Timeframe · Trading Psychology · Backtesting
M1 to W1 · Strategy Guide
Best Trading Timeframes for Backtesting & Strategies: From Microscope to Telescope

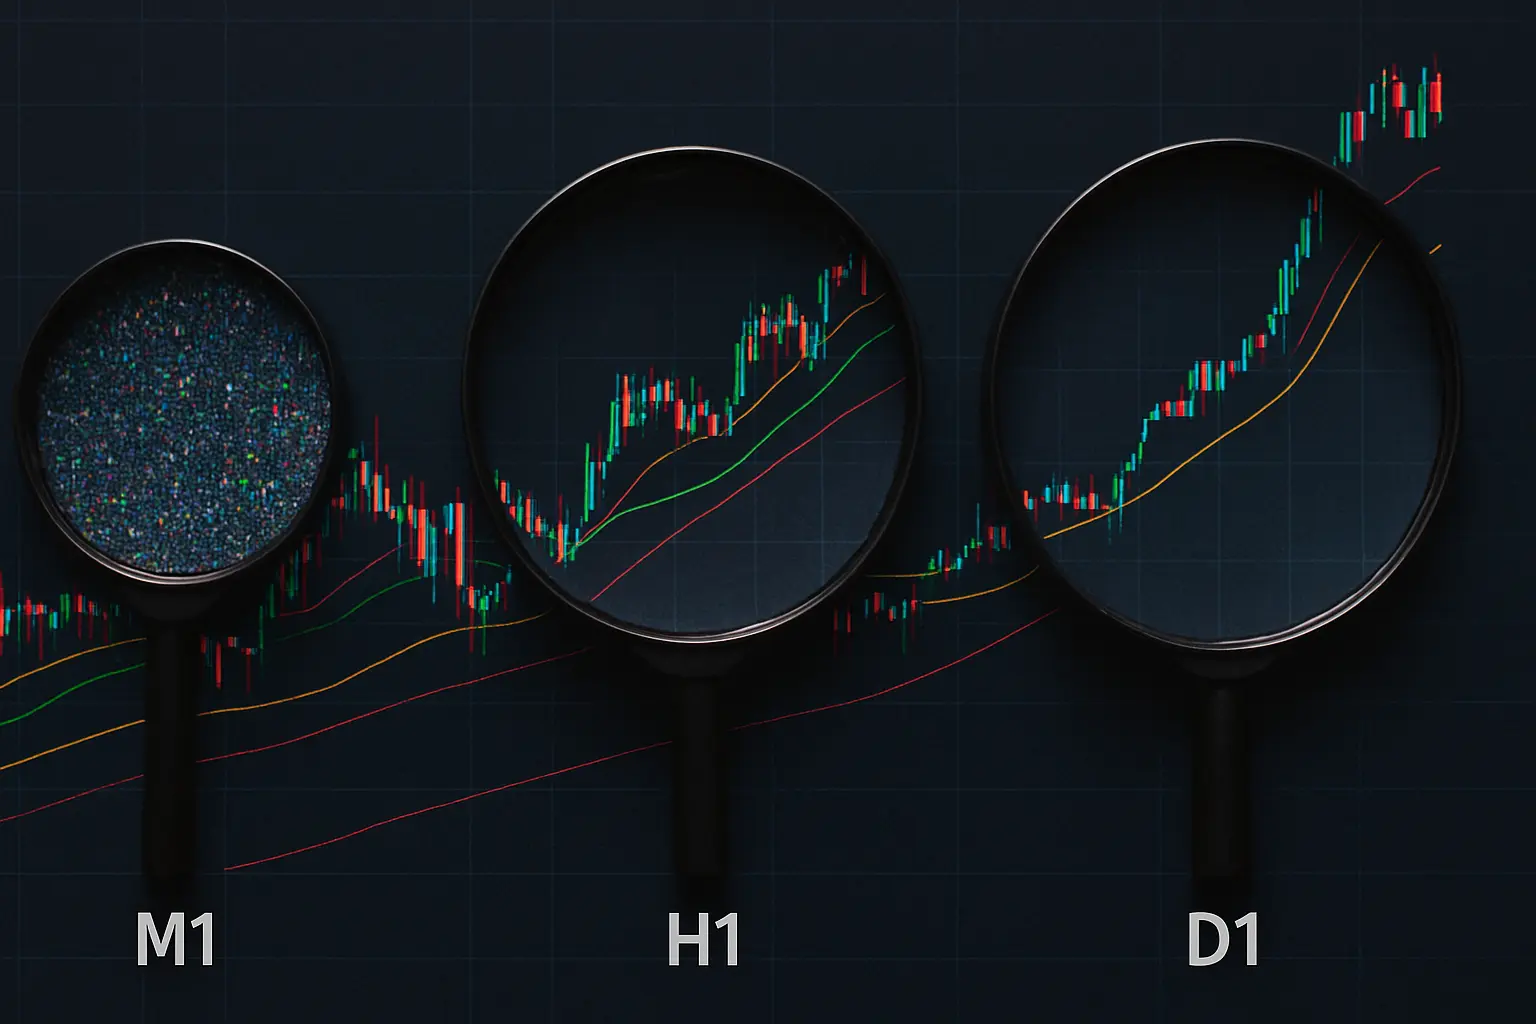
Figure 1: Three traders, three timeframes, three different views of the same market
John, Sara, and Jordan are all traders, yet they live in completely different worlds. Your chosen timeframe is the lens through which you see the market. Choosing the wrong lens, even with the best strategy in the world, is doomed to fail.
John – Short-Term
1‑minute charts, scalping. Heart pounds with every tiny move.
Sara – Medium-Term
4‑hour charts, swing trading. Checks charts 2‑3 times a day.
Jordan – Long-Term
Weekly charts, position trading. Waits for big moves.
In this article, we dive deep into how trading timeframes affect your strategy, psychology, lifestyle, and even backtesting results. Did you know the same strategy can be profitable on the 5‑minute chart but lose money on the 1‑hour chart?
Understanding Timeframe — Beyond a Simple Time Unit
What is a Timeframe and Why is it Critical?
At first glance, a timeframe is just the period each candle represents. But in reality, it is your perception window into the market.
🗺️
![]()
M1 = neighbourhood map (great detail, poor overview) · H1 = city map (balanced) · D1 = country map (broad view)
Figure 2: How different timeframes reveal different levels of market structure
Timeframe as a Geographical Map:
- 1 min Like a neighbourhood map – great detail, poor overview.
- 1 hour Like a city map – balance between detail and overview.
- Daily Like a country map – excellent overview, few details.
General Timeframe Categories
Short‑Term (Scalping)
- M1, M5, M15
- High trade frequency, intense noise, requires constant attention.
Medium‑Term (Swing)
- H1, H4
- Balance between trade frequency and signal quality.
Long‑Term (Position)
- D1, W1, MN
- Few trades, high‑quality signals.
How Timeframe Transforms Your Strategy
A Strategy that Looks Great on Paper May Behave Differently on Each Timeframe
Example: a breakout strategy. The same logic produces vastly different results on M5, H4, and D1.
On M5
- Many signals per day
- Many false breakouts
- Spread & commission have a huge impact
On H4
- 2‑3 signals per month
- Fewer false breakouts
- Spread impact is moderate
On Daily
- 2‑3 signals per year
- False breakouts are very rare
- Spread is almost negligible
Indicator Behaviour Across Timeframes
20‑period Moving Average:
- M5: reflects last 100 minutes of price action.
- H1: reflects last 20 hours.
- D1: reflects last 20 days.
RSI on Different Timeframes:
- Short‑term: many signals, high volatility.
- Long‑term: fewer signals, but more reliable.
Timeframe & Backtesting — A Complex Relationship
Why Do Backtest Results Differ Across Timeframes?
Understanding these differences can save you from costly mistakes.
📈 Backtest Performance Comparison: M5 vs H4 vs D1
Equity curves showing how the same strategy performs differently — M5 shows volatility, D1 shows smoother growth
Figure 4: Equity curve comparison — smoother equity growth on higher timeframes
Short Timeframes (M1–M15)
- Very high market noise
- Many false signals
- Need extra filters
- Backtests may show unrealistic profits
Long Timeframes (H4–D1)
- Low market noise
- Fewer false signals
- Simpler strategies often work
- More realistic backtest results
Impact of Slippage & Trading Costs
Most backtesting platforms do not simulate slippage accurately. Slippage occurs when your order fills at a worse price than expected, especially in fast markets. On short timeframes, a few milliseconds can turn a winner into a loser.
Short Timeframes:
- Many trades → high cumulative spread/commission.
- Slippage can destroy small profits.
- Backtests may show profit, but reality may be loss.
Long Timeframes:
- Few trades → low cumulative costs.
- Slippage impact is minimal.
- Backtest results closer to reality.
⚠️ Warning: Historical Data Quality
- M1 and M5 data may have gaps or be incomplete.
- Higher timeframes (H4, D1) have more reliable data.
Timeframe Analysis Across Different Markets
Forex
- Scalping: M5–M15
- Swing: H1–H4
- Position: D1–W1
Crypto
- Beginners: H4–D1
- Advanced: M15–H1
- Scalping (pro): M1–M15
Timeframe Psychology — The Overlooked Factor
How Timeframe Affects Your Mindset
This may be more important than technical analysis. Your timeframe must match your personality.
Short‑Term Lifestyle
- Constant screen time
- High stress
- Full‑time trading
- Quick mental fatigue
- Strong reaction to news
Long‑Term Lifestyle
- Plenty of free time
- Low stress
- Good for second job
- Deep analysis possible
- Less emotional reaction
Quick Personality Check
Short‑term suits you if: you are impatient, enjoy adrenaline, can decide in a split second, and stress drives you.
Long‑term suits you if: you are patient, enjoy deep research, avoid rushed decisions, and stress bothers you.
Smart Backtesting Across Timeframes
How to Test Your Strategy on Multiple Timeframes
On Algotradium, you can test the same strategy simultaneously on several timeframes and compare results.
Test 1: Strategy Stability
- Is your strategy profitable on M15, H1, and H4?
- If it only works on one timeframe, overfitting is likely.
- Stable across timeframes → more reliable.
Test 2: Parameter Optimisation
- Optimal parameters on M5 differ from H4.
- Optimise separately for each timeframe.
- Avoid overfitting to a single timeframe.
Test 3: Cost Impact
- Calculate spread & commission per timeframe.
- Assess real profitability after costs.
- Simulate slippage for high‑frequency trades.
Common Timeframe Selection Errors
Error 1: Too Short for Beginners
- Temptation of quick profits
- Lack of market understanding
- Guaranteed long‑term failure
- Rapid burnout
Error 2: Mismatch with Personality
- Impatient person on daily charts
- Cautious person on 1‑minute charts
- No enjoyment in trading
- Constant stress & exhaustion
Error 3: Constantly Changing Timeframes
- Never master any timeframe
- Confusion in analysis
- Loss of strategy coherence
- No focused experience
Error 4: Ignoring Costs
- Not accounting for spread on short timeframes
- Ignoring commission impact
- Theoretical profit in backtest, loss in reality
- No realistic simulation
Comprehensive Timeframe Comparison
| Parameter | Short (M5) | Medium (H1) | Long (D1) |
|---|
| Daily trades | Very high (5+) | Medium (0.5‑1) | Low (0.1‑0.2) |
| Market noise | Very high | Medium | Low |
| Spread impact | Very significant | Moderate | Negligible |
| Time required | Full‑time | Part‑time | Low |
| Stress level | Very high | Moderate | Low |
| Signal quality | Low | Moderate | High |
Multi‑Timeframe Strategy — The Professional Approach
Large TF (Direction)
W1 or D1 to identify the main trend.
Medium TF (Planning)
H4 to spot key zones and entry points.
Small TF (Execution)
H1 or M15 for precise entry timing.
1 Identify main trend on D1.
2 Wait for pullback on H4.
3 Enter on reversal candle on H1.
4 Set stop/take profit based on H4.
Practical Roadmap to Find Your Optimal Timeframe
1 Analyse your personality & lifestyle – how much time, stress tolerance, financial goals.
2 Test your strategy across timeframes from M15 to D1, compare results.
3 Review key metrics – number of trades, avg profit/trade, max drawdown, profit factor.
4 Demo test for at least 2 weeks on your chosen timeframe.
5 Go live with small size, gradually increase as confidence grows.
Conclusion: Find Your Perfect Timeframe
The right timeframe is like a well‑fitted shoe
It must fit you perfectly. Another may look nicer, but if it doesn't fit, it will only cause pain.
Key Takeaways:
- No absolute "best" timeframe – only what suits your personality, goals, and lifestyle.
- Backtest across multiple timeframes – a strategy can be magic on one and a disaster on another.
- Don't underestimate costs – on short timeframes, spread and commission can eat all your profits.
- Psychology matters more than technique – even the best strategy fails if the timeframe clashes with your mindset.
- Multi‑timeframe is for professionals – but start by mastering one timeframe first.
Final Suggestion
Today, on Algotradium, test your current strategy across three different timeframes. You'll be amazed at the differences. Remember, finding the right trading timeframe is half the battle won in trading.
best trading timeframe
timeframe selection
backtesting timeframes
daily trading
multi‑timeframe strategy
timeframe psychology
scalping
swing trading
position trading
technical analysis
risk management
strategy backtest