
In this hands-on Python backtesting tutorial, you'll build and test a complete SMA crossover trading strategy using the backtesting.py library. Starting with historical BTC-USD data, we'll install the required Python packages, create entry and exit rules, add stop-loss and take-profit levels, and evaluate the final strategy using performance metrics.
This guide focuses on the practical process of backtesting a trading strategy in Python rather than covering every Python backtesting framework. For a broader comparison of backtesting concepts, libraries, and workflows, see our complete Python backtesting guide.
We'll cover four main phases:
By the end, you'll have a working Python file that can test your final strategy on any asset and produce a comprehensive report.
Before building our trading strategy, we need to prepare a simple Python environment. In this tutorial, we'll use backtesting.py as the backtesting framework and a few supporting Python libraries for market data, calculations, and technical indicators.
This tutorial focuses on the practical process of backtesting a trading strategy in Python. If you're looking for a broader introduction to Python backtesting, including different frameworks, backtesting concepts, performance metrics, and advanced techniques, see our complete Python backtesting guide .
For this hands-on project, we'll use backtesting.py because its strategy API is simple enough to follow while still providing the essential features needed to simulate trades and evaluate a strategy.
The library lets us define a trading strategy with a Python class, calculate indicators, create entry and exit rules, execute a historical simulation, and inspect important results such as total return, drawdown, win rate, and Sharpe ratio.
Rather than comparing multiple Python backtesting frameworks here, we'll use backtesting.py throughout the tutorial so that we can concentrate on building and testing an actual trading strategy.
We only need a small set of libraries to complete this project. Each library has a specific role in the workflow:
| Library | Purpose in This Tutorial |
|---|---|
| backtesting.py | Builds the trading strategy, simulates trades, and generates backtest results. |
| pandas | Handles and processes historical market data. |
| NumPy | Supports numerical calculations used by indicators and strategy logic. |
| yfinance | Downloads historical market data for the example strategy. |
| pandas-ta | Provides technical indicators that can be used when extending the strategy. |
| matplotlib | Creates charts and visualizations for market and strategy analysis. |
Install all required packages with:
pip install backtesting pandas numpy pandas-ta yfinance matplotlib
After installing the packages, verify that Python can import the libraries correctly.
Create a file named test_install.py and add the following code:
import backtesting
import pandas as pd
import numpy as np
import yfinance as yf
import matplotlib

print("All required libraries were imported successfully.")
print("backtesting.py version:", backtesting.__version__)
print("pandas version:", pd.__version__)
Run the file from your terminal:
python test_install.py
If the imports complete without errors and the package versions are displayed, your environment is ready for the next step.
yfinance is used in this tutorial to retrieve historical market data. Depending on your network or region, access to Yahoo Finance data may occasionally fail or return incomplete data.
If that happens, you can still continue experimenting with backtesting.py using its built-in sample datasets:
from backtesting.test import EURUSD, BTCUSD
For the main project in this tutorial, however, we'll use historical market data downloaded with yfinance.
Next: Now that our Python environment is ready, we'll download and prepare historical market data for the backtest.
Historical data is the fuel for our backtest engine. Without accurate, complete data, any result is meaningless.
The yfinance library provides easy access to decades of historical data for thousands of stocks and ETFs.
# File: download_data.py
import yfinance as yf
import pandas as pd
import matplotlib.pyplot as plt

# 1. Set download parameters
SYMBOL = "BTC-USD"
START_DATE = "2020-01-01"
END_DATE = "2025-12-01"
INTERVAL = "1d"

print(f"Downloading data for {SYMBOL} from {START_DATE} to {END_DATE}...")

# 2. Download data
df = yf.download(
    tickers=SYMBOL,
    start=START_DATE,
    end=END_DATE,
    interval=INTERVAL,
    progress=False
)

print(f"\n✅ Download complete. {len(df)} rows received.")
print("Date range:", df.index[0].strftime('%Y-%m-%d'), "to", df.index[-1].strftime('%Y-%m-%d'))

# 3. Save to CSV for later use
csv_filename = f"{SYMBOL}_historical.csv"
df.to_csv(csv_filename)
print(f"\n💾 Data saved to '{csv_filename}'")
The downloaded data is a pandas DataFrame with these columns:
For backtesting, we typically use Adj Close for more realistic analysis.
Now it's time to bring our trading idea to life. We'll use the backtesting.py library, which provides a clean and efficient framework for this.
Every strategy is a Python class that inherits from the base Strategy class. It has two key methods:
# File: simple_sma_crossover.py
import pandas as pd
import yfinance as yf
from backtesting import Backtest, Strategy
from backtesting.lib import crossover

class SimpleSMACrossover(Strategy):
    # Strategy parameters
    n1 = 20
    n2 = 50

    def init(self):
        close_prices = self.data.Close
        self.sma_short = self.I(
            lambda x: pd.Series(x).rolling(self.n1).mean(),
            close_prices, name=f'SMA{self.n1}'
        )
        self.sma_long = self.I(
            lambda x: pd.Series(x).rolling(self.n2).mean(),
            close_prices, name=f'SMA{self.n2}'
        )

    def next(self):
        # Buy signal: no position and SMA short crosses above SMA long
        if not self.position and crossover(self.sma_short, self.sma_long):
            self.buy()

        # Sell signal: in a position and SMA long crosses above SMA short
        elif self.position and crossover(self.sma_long, self.sma_short):
            self.position.close()

if __name__ == "__main__":
    # Download data
    data = yf.download("BTC-USD", start="2020-01-01", end="2025-12-01")

    # Handle MultiIndex columns from yfinance
    if isinstance(data.columns, pd.MultiIndex):
        data.columns = [col[0] for col in data.columns]

    # Create and run backtest
    bt = Backtest(data, SimpleSMACrossover,
                  cash=1000000,
                  commission=.001,
                  exclusive_orders=True)

    output = bt.run()

    # Display key results
    print("\n" + "="*50)
    print("📊 Backtest Results")
    print("="*50)
    print(f"Total Return: {output['Return [%]']:.2f}%")
    print(f"Final Equity: ${output['Equity Final [$]']:.2f}")
    print(f"Max Drawdown: {output['Max. Drawdown [%]']:.2f}%")
    print(f"Total Trades: {output['# Trades']}")
    print(f"Win Rate: {output['Win Rate [%]']:.2f}%")

    # Plot interactive charts
    bt.plot()
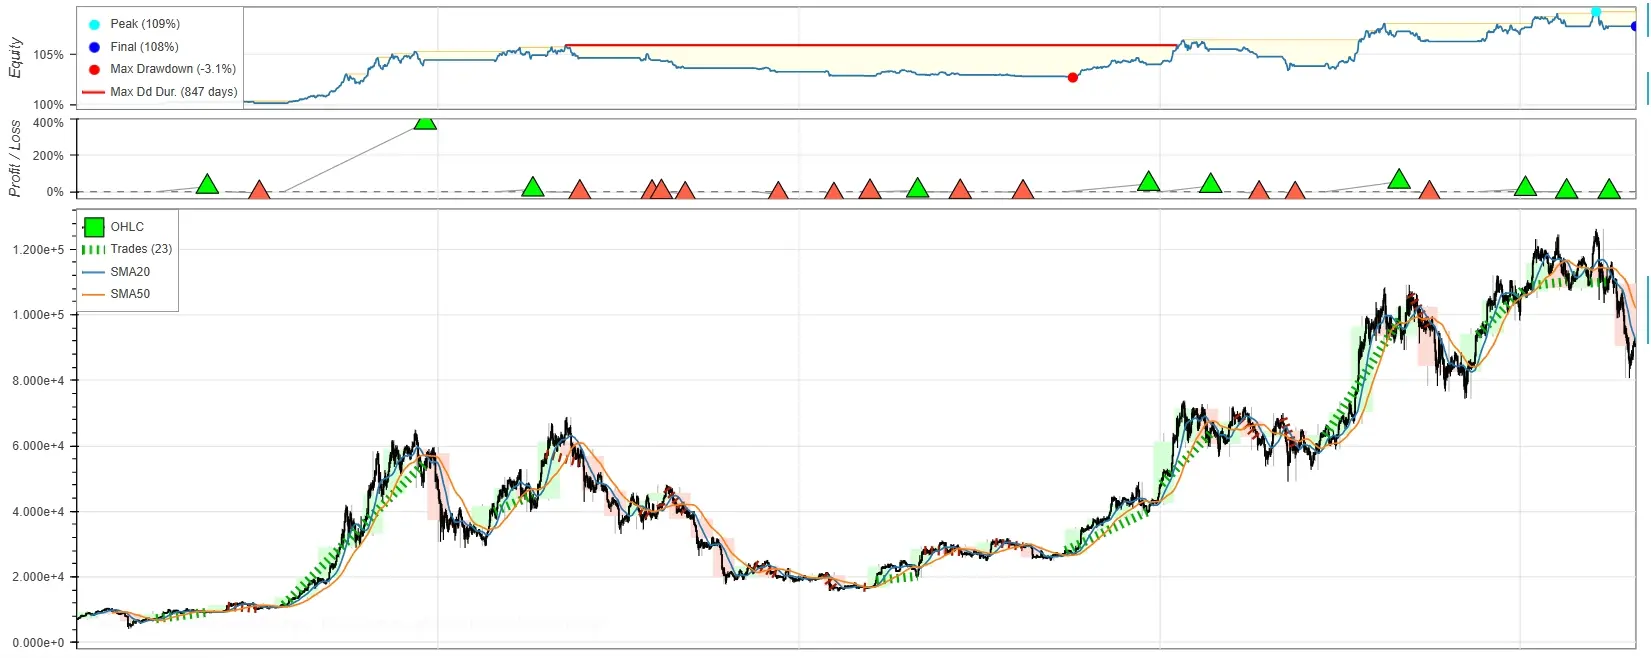
Pro Tip for Crypto: Use FractionalBacktest instead of Backtest for cryptocurrencies, as it allows fractional asset purchases.
Our simple strategy only uses SMA signals. But a professional trader always manages risk. Let's add two key rules:
# File: sma_crossover_with_sltp.py
import pandas as pd
from backtesting import Strategy
from backtesting.lib import crossover, FractionalBacktest

class SMACrossWithSLTP(Strategy):
    n1 = 20
    n2 = 50
    stop_loss_pct = 0.08   # 8% stop loss
    take_profit_pct = 0.035    # 350% take profit

    def init(self):
        close = self.data.Close
        self.sma_short = self.I(lambda x: pd.Series(x).rolling(self.n1).mean(), close)
        self.sma_long = self.I(lambda x: pd.Series(x).rolling(self.n2).mean(), close)

    def next(self):
        price = self.data.Close[-1]

        if not self.position:
            if crossover(self.sma_short, self.sma_long):
                sl = price * (1 - self.stop_loss_pct)
                tp = price * (1 + self.take_profit_pct)
                self.buy(sl=sl, tp=tp)

        elif self.position and crossover(self.sma_long, self.sma_short):
            self.position.close()
When you run the comparison, you'll typically see:
The goal is to find the right balance between return and risk.

Now let's make our strategy smarter. The RSI indicator helps us identify overbought and oversold conditions. We can use it to filter our SMA signals.
New Logic: Buy only when: 1) SMA gives a buy signal AND 2) RSI is below 30 (oversold). This means the market is correcting and a trend reversal is more likely.
# File: advanced_strategy.py
import pandas as pd
import numpy as np
from backtesting import Backtest, Strategy
from backtesting.lib import crossover

def calculate_rsi(series: pd.Series, period: int = 14) -> pd.Series:
    delta = series.diff()
    gain = (delta.where(delta > 0, 0)).rolling(window=period).mean()
    loss = (-delta.where(delta < 0, 0)).rolling(window=period).mean()
    rs = gain / loss
    return 100 - (100 / (1 + rs))

class AdvancedSMARSIStrategy(Strategy):
    sma_short = 20
    sma_long = 50
    rsi_period = 14
    rsi_oversold = 30
    rsi_overbought = 70
    stop_loss = 0.06
    take_profit = 0.12

    def init(self):
        close = self.data.Close
        self.sma_fast = self.I(lambda x: pd.Series(x).rolling(self.sma_short).mean(), close)
        self.sma_slow = self.I(lambda x: pd.Series(x).rolling(self.sma_long).mean(), close)
        self.rsi = self.I(lambda x: calculate_rsi(pd.Series(x), self.rsi_period), close)

    def next(self):
        price = self.data.Close[-1]
        rsi_val = self.rsi[-1] if not np.isnan(self.rsi[-1]) else 50

        if not self.position:
            if crossover(self.sma_fast, self.sma_slow) and rsi_val < self.rsi_oversold:
                sl = price * (1 - self.stop_loss)
                tp = price * (1 + self.take_profit)
                self.buy(sl=sl, tp=tp)

        elif self.position:
            if crossover(self.sma_slow, self.sma_fast) or rsi_val > self.rsi_overbought:
                self.position.close()
Now we have all the pieces. Let's run our final combined strategy on some data and generate a professional report.
Congratulations! You've completed this simple Python backtesting tutorial and now know how to build, test, and improve trading strategies using Python. The strategy includes moving averages, RSI filtering, stop loss, take profit, and a professional performance report.
# File: final_backtest_project.py
import pandas as pd
import numpy as np
import yfinance as yf
from datetime import datetime
from backtesting import Strategy
from backtesting.lib import crossover, FractionalBacktest

# RSI calculation function
def calculate_rsi(series, period=14):
    delta = series.diff()
    gain = (delta.where(delta > 0, 0)).rolling(window=period).mean()
    loss = (-delta.where(delta < 0, 0)).rolling(window=period).mean()
    rs = gain / loss
    return 100 - (100 / (1 + rs))

# Final combined strategy
class FinalCombinedStrategy(Strategy):
    sma_short = 20
    sma_long = 60
    rsi_period = 14
    rsi_oversold = 35
    rsi_overbought = 75
    stop_loss = 0.05
    take_profit = 0.15

    def init(self):
        close = self.data.Close
        self.sma_fast = self.I(lambda x: pd.Series(x).rolling(self.sma_short).mean(), close)
        self.sma_slow = self.I(lambda x: pd.Series(x).rolling(self.sma_long).mean(), close)
        self.rsi = self.I(lambda x: calculate_rsi(pd.Series(x), self.rsi_period), close)

    def next(self):
        price = self.data.Close[-1]
        rsi_val = self.rsi[-1]

        if not self.position:
            if crossover(self.sma_fast, self.sma_slow) and rsi_val < self.rsi_oversold:
                sl = price*(1-self.stop_loss)
                tp = price*(1+self.take_profit)
                self.buy(sl=sl, tp=tp)

        elif self.position:
            if crossover(self.sma_slow, self.sma_fast) or rsi_val > self.rsi_overbought:
                self.position.close()

# Main execution
if __name__ == "__main__":
    TICKER = "BTC-USD"
    YEARS = 5
    end_date = datetime.now().strftime("%Y-%m-%d")
    start_date = (datetime.now() - pd.DateOffset(years=YEARS)).strftime("%Y-%m-%d")

    print(f"Symbol: {TICKER}")
    print(f"Period: {start_date} to {end_date} ({YEARS} years)")

    data = yf.download(TICKER, start=start_date, end=end_date, progress=False)

    # Clean up columns
    if isinstance(data.columns, pd.MultiIndex):
        data.columns = [col[0] for col in data.columns]

    bt = FractionalBacktest(data, FinalCombinedStrategy,
                           fractional_unit=1e-06,
                           cash=1000,
                           commission=.002,
                           margin=1,
                           exclusive_orders=True)

    results = bt.run()

    # Print comprehensive report
    print("\n" + "#"*70)
    print("Final Backtest Report")
    print("#"*70)

    print("\n1. 📊 Overall Performance")
    print("-"*40)
    print(f"   Total Return: {results['Return [%]']:+.2f}%")
    print(f"   Final Equity: ${results['Equity Final [$]']:.2f}")

    print("\n2. 🛡️ Risk Metrics")
    print("-"*40)
    print(f"   Max Drawdown: {results['Max. Drawdown [%]']:.2f}%")
    print(f"   Sharpe Ratio: {results.get('Sharpe Ratio', 'N/A'):.2f}")

    print("\n3. 🔄 Trade Statistics")
    print("-"*40)
    print(f"   Total Trades: {results['# Trades']}")
    if results['# Trades'] > 0:
        print(f"   Win Rate: {results['Win Rate [%]']:.1f}%")
        print(f"   Profit Factor: {results['Profit Factor']:.2f}")

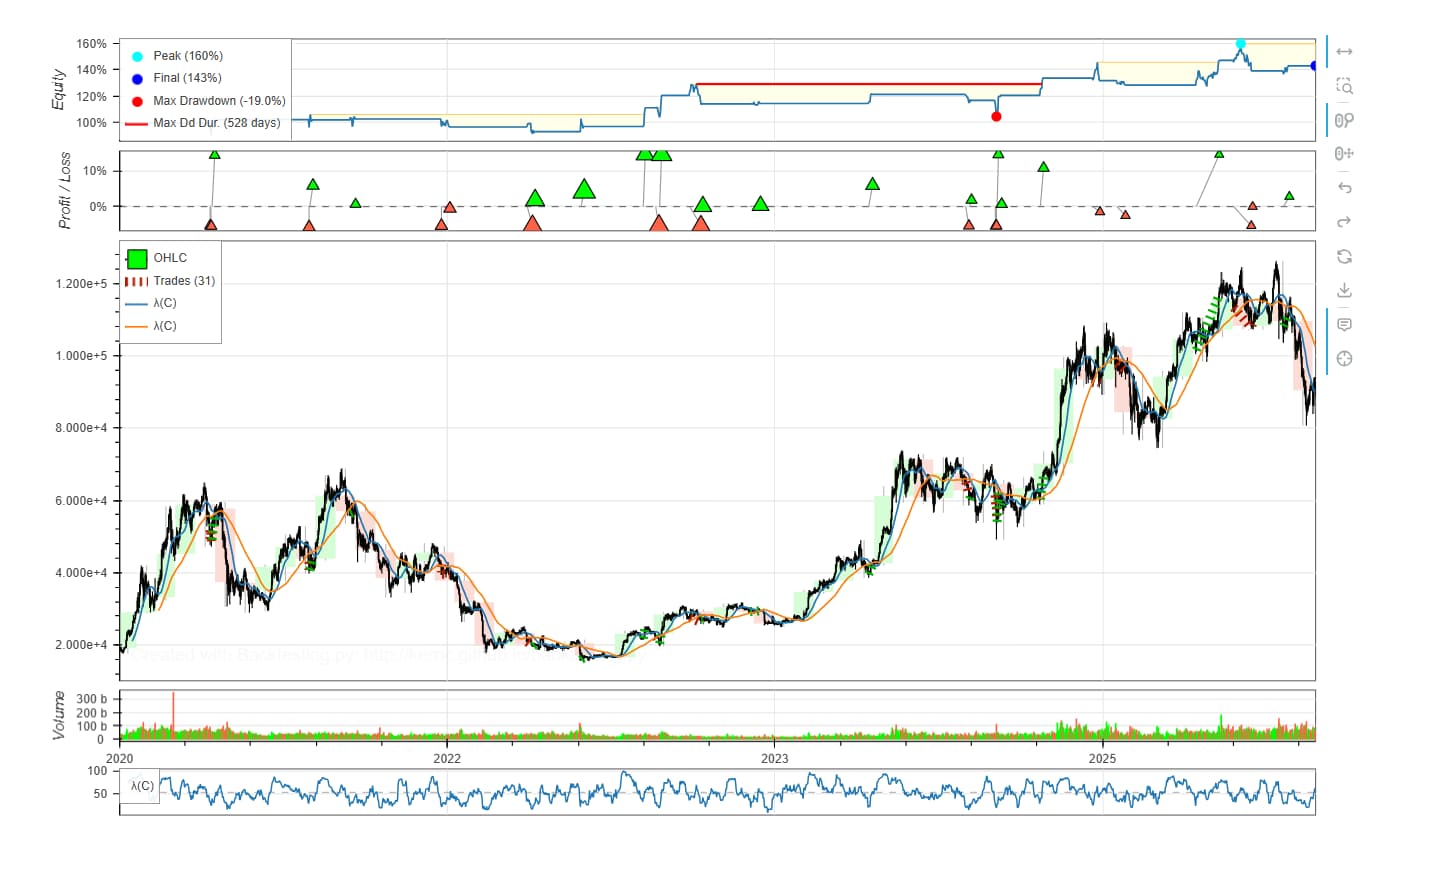
    bt.plot()
The Algotradium platform was designed to simplify and make accessible the backtesting and strategy-building process. It offers a web-based solution that removes many obstacles found in traditional platforms.
Simply open your web browser and go to the Algotradium platform. You do not need a broker account — just a simple registration on the platform itself.
Algotradium offers two powerful ways to define strategies:
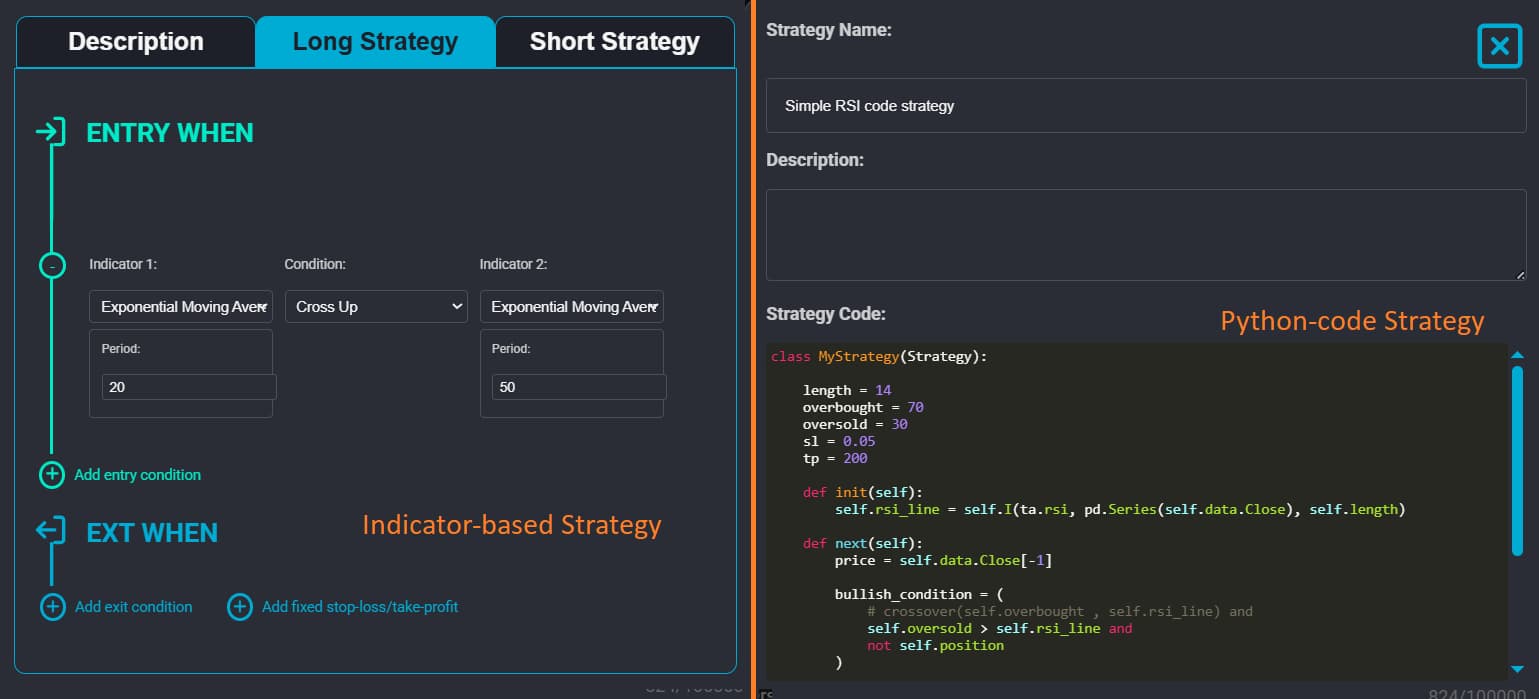
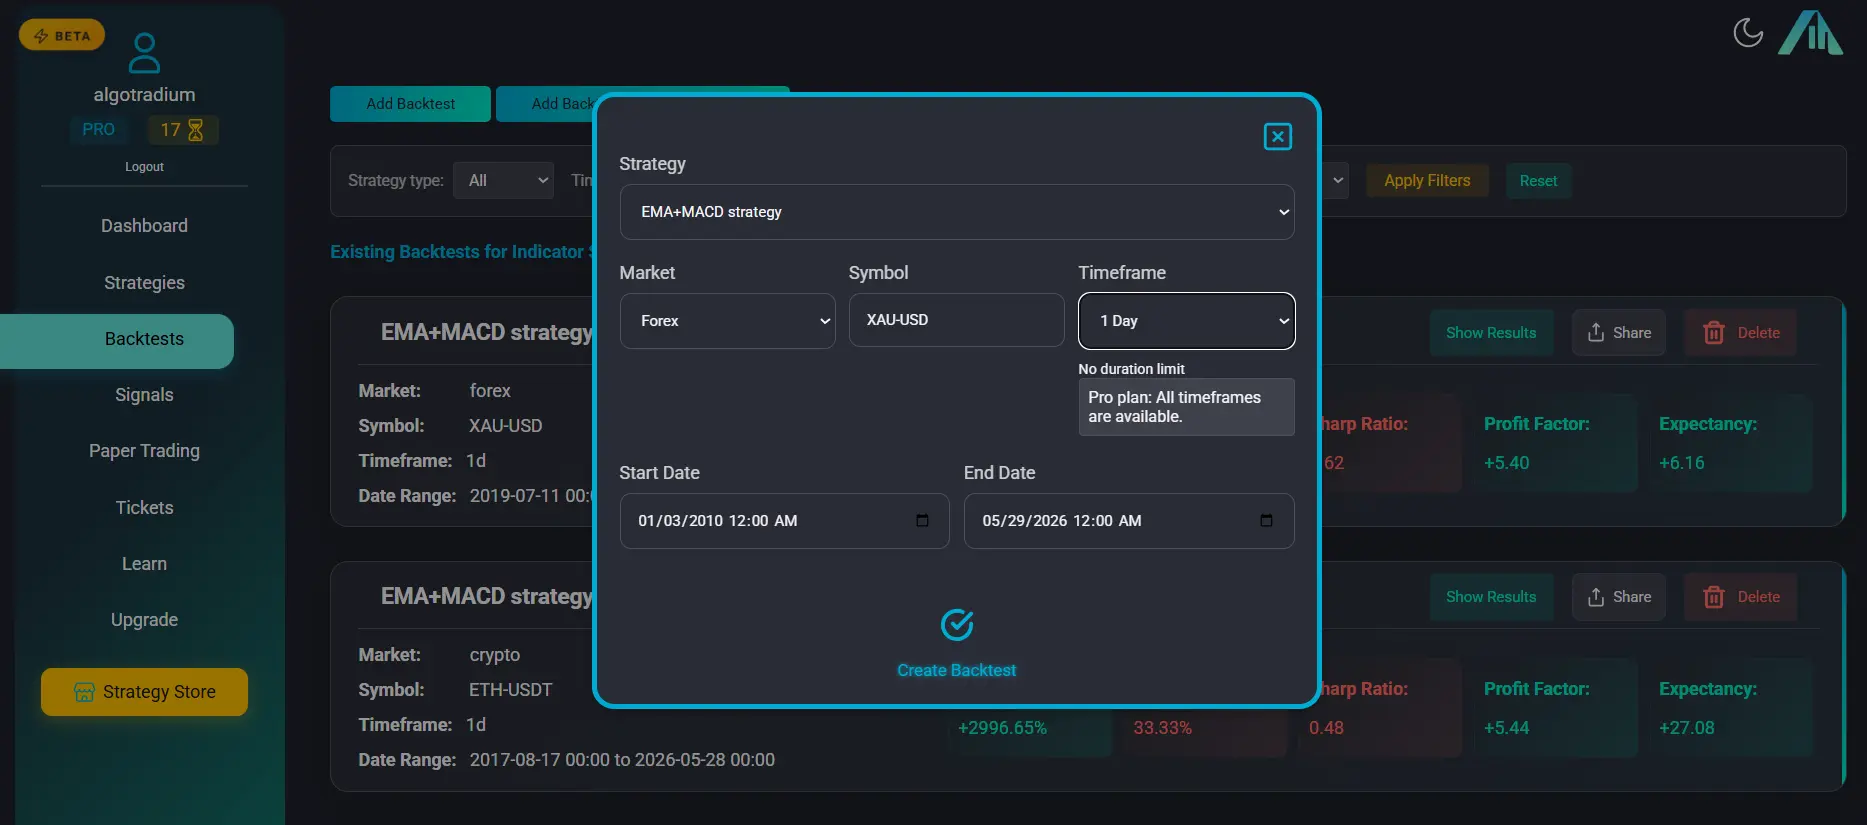
After saving your strategy, go to the Backtests section and click "Add Backtest".
Choose your previously defined strategy
Choose market (Forex, Crypto, Gold/Silver) and specific symbol
Choose timeframe from 1 minute to 1 day
Specify exact start and end dates
Click "Create Backtest" and then "Run Backtest"
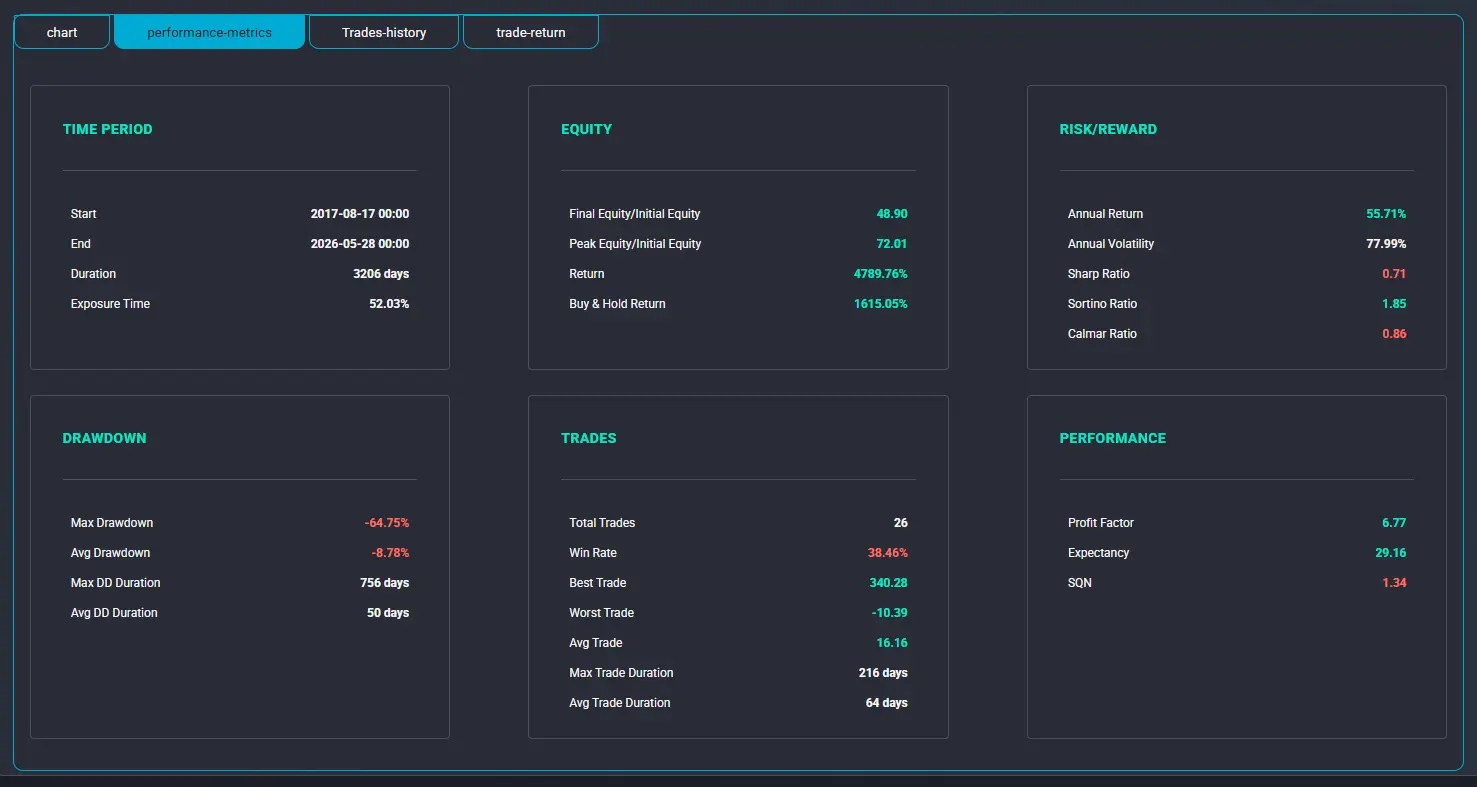
Algotradium calculates and displays a wide range of performance metrics:
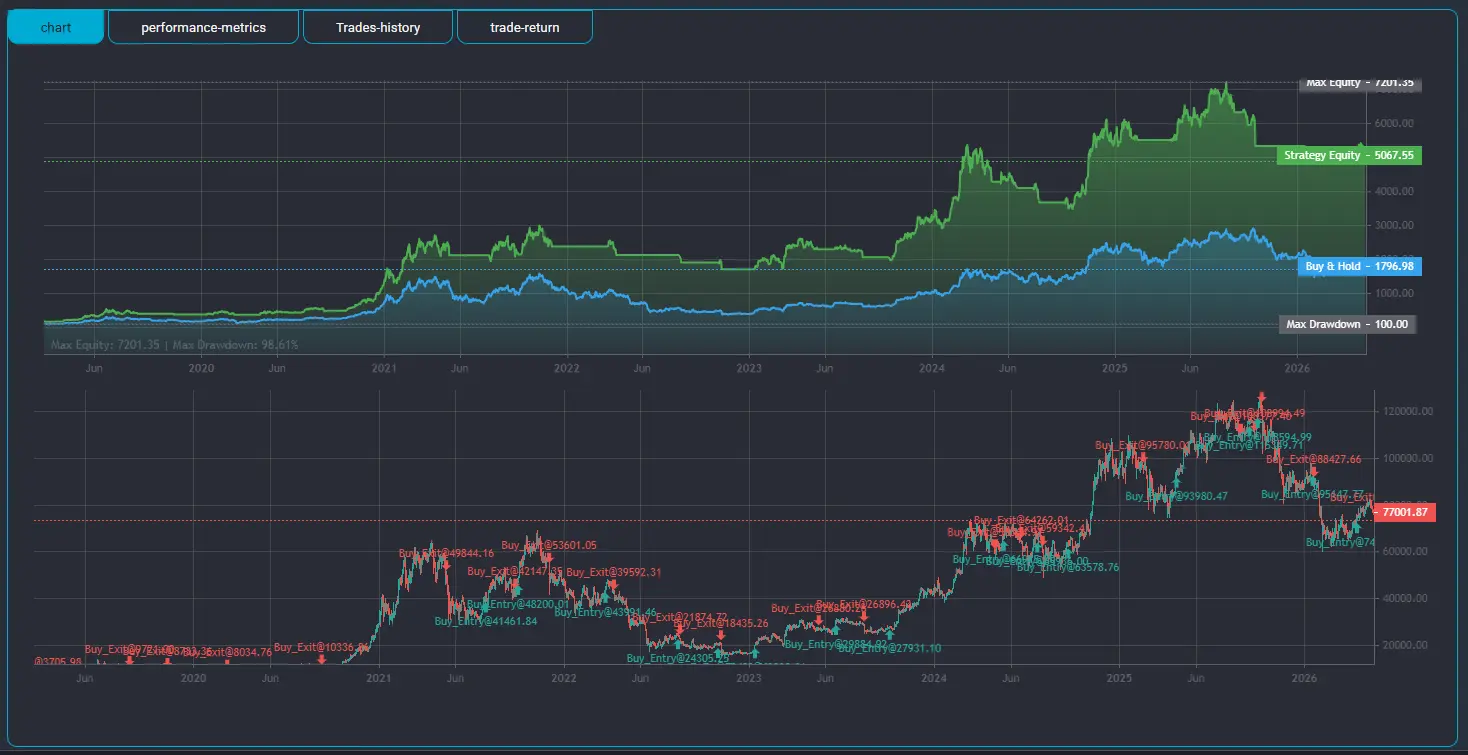
Main price chart with clear markers showing entry (green arrow) and exit (red arrow) points for each trade.
Two curves on one chart: Equity Curve (account growth) and Buy & Hold Curve for easy comparison.
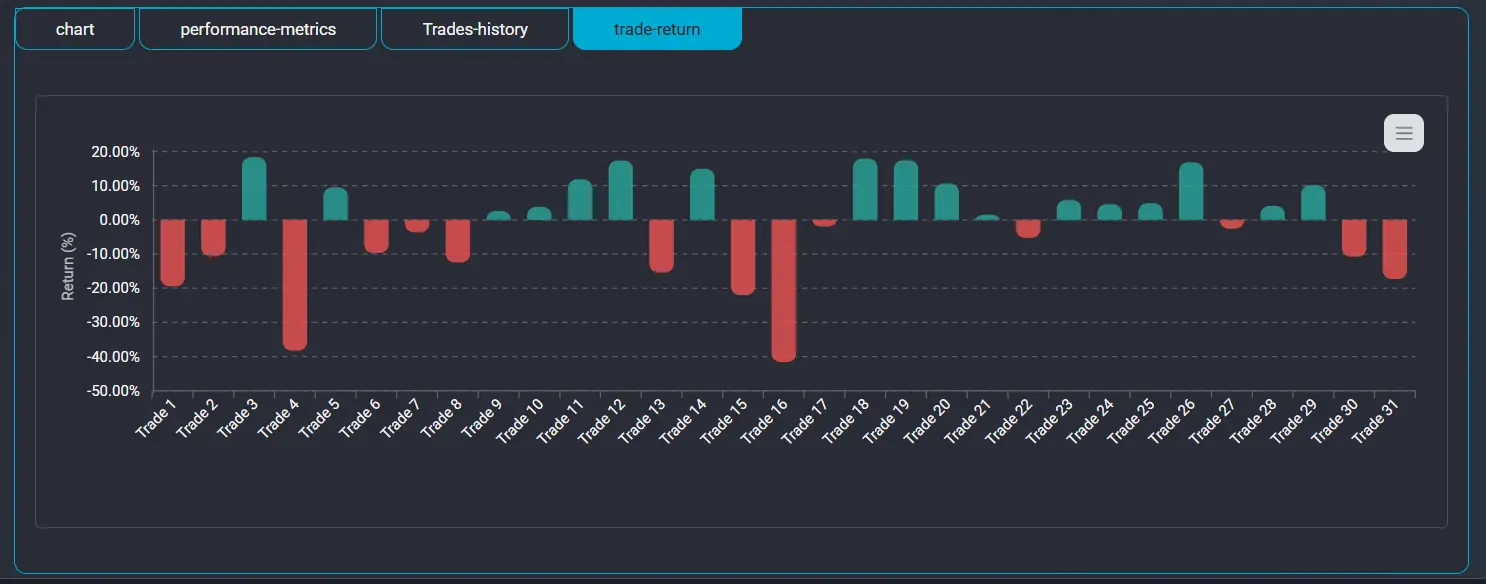
Bar chart showing profit/loss of each trade in chronological order — easily identify winning and losing sequences.
A unique feature of Algotradium is the ability to save every backtest result. You can store results from different tests and revisit or compare them anytime.
For deeper analysis, download complete trade reports as CSV files to open in Excel or Google Sheets for advanced statistical analysis.
Congratulations! You now have the ability to backtest a trading strategy from scratch. You've not only tested a simple strategy but also enhanced it with risk management rules and additional filters to create a more robust trading system.
In the next article, we'll cover "How to Optimize a Trading Strategy with Python". We'll learn how to automatically find the best parameters for your strategy using heatmaps and validation techniques to avoid overfitting.
Backtest results do not guarantee future profitability. Markets are dynamic and conditions change. Always:
The goal of backtesting is to increase the probability of success and reduce unnecessary risk, not to guarantee certain profits.
Want to continue learning? Read our comprehensive guide: Python Backtesting: The Complete Guide (2026) .
A simple Python backtesting tutorial teaches beginners how to test trading strategies on historical market data using Python. It explains how to install the required libraries, download market data, create trading rules, run a backtest, and evaluate the results before risking real money.
Popular Python backtesting libraries such as backtesting.py, Backtrader, and vectorbt make this process much easier by handling trade execution, portfolio management, and performance reporting automatically.
Yes. backtesting.py is a free and open-source Python library released under an open-source license. Anyone can install it using pip and use it for educational, research, or commercial projects.
Because it is open source, the community continuously improves the library by fixing bugs and adding new features. It also integrates well with popular Python packages such as pandas, NumPy, matplotlib, and yfinance.
Absolutely. Python is widely used for cryptocurrency strategy development and backtesting. Historical crypto data can be downloaded from services like Yahoo Finance, Binance, KuCoin, or other exchanges through APIs such as CCXT.
For cryptocurrencies, many traders use fractional position sizing because digital assets can usually be purchased in small fractions. Libraries like backtesting.py support this through FractionalBacktest, making crypto simulations more realistic.
No. Backtesting never guarantees future profitability. Historical performance only shows how a strategy would have behaved under past market conditions. Financial markets constantly evolve, meaning a profitable strategy today may stop working tomorrow.
To improve confidence in a strategy, traders should combine backtesting with out-of-sample testing, walk-forward analysis, and forward testing on live markets using small position sizes. Proper risk management remains essential regardless of historical results.
The amount of historical data depends on your trading strategy and timeframe. Swing trading strategies usually require several years of daily data, while intraday strategies may need millions of minute-level records. In general, using multiple market conditions—including bull, bear, and sideways markets—produces more reliable backtesting results.
Yes. Python backtesting works with virtually any financial market as long as historical OHLCV data is available. The same strategy framework can be adapted to stocks, ETFs, forex, cryptocurrencies, commodities, indices, and futures by simply loading the appropriate historical dataset.
Backtesting evaluates a trading strategy using historical market data, while paper trading tests the strategy in real-time market conditions without risking real money. Backtesting is faster because it simulates years of data in minutes, whereas paper trading reflects current market behavior and execution conditions.