
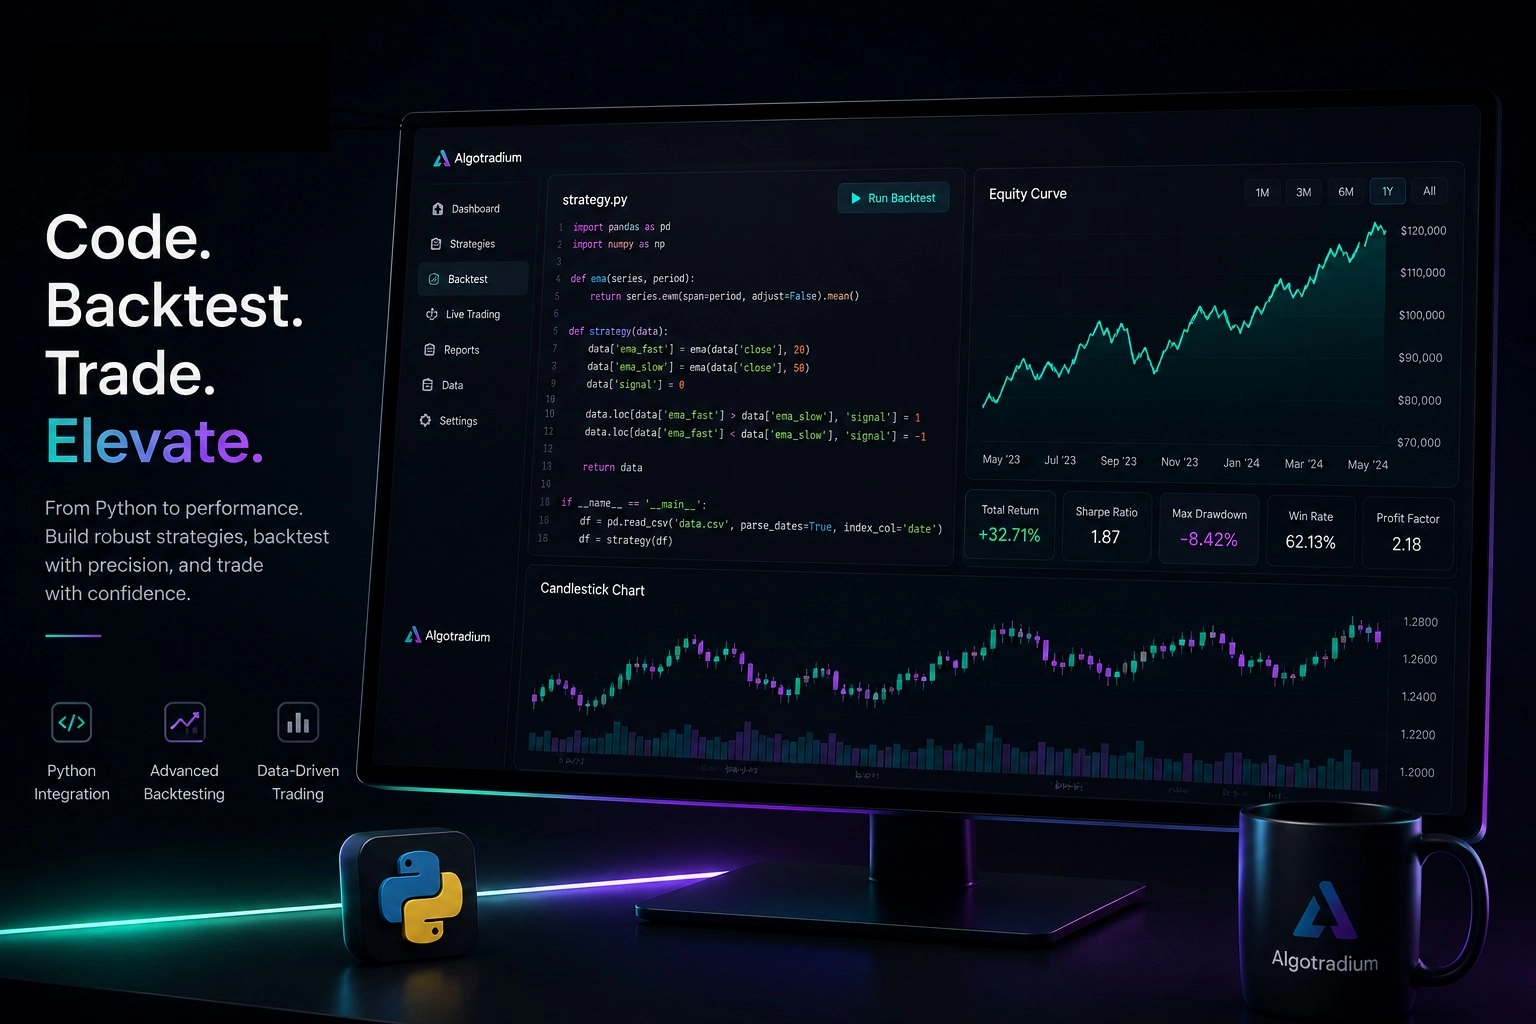
In this comprehensive guide, you'll learn everything about Python backtesting. We cover setup, implementation, advanced techniques, and best practices for Python trading strategy, backtesting.py, algorithmic trading.
Before deploying a trading strategy with real money, one question matters:Would this strategy have survived previous market conditions?Python backtesting helps traders answer this question by simulating strategies on historical market data.In this guide, you will learn how to build a complete Python backtesting workflow — from downloading market data and writing your first strategy to optimization, validation, and avoiding common mistakes.
In real algorithmic trading projects, the biggest challenge is often not writing the strategy code but preparing reliable data, modeling realistic execution, and avoiding misleading backtest results.
Backtesting involves applying a set of trading rules to historical price data to generate hypothetical trades and measure performance metrics such as total return, Sharpe ratio, maximum drawdown, and win rate. For example, a simple moving average crossover strategy might buy when a short-term average crosses above a long-term average and sell when it crosses below. By backtesting this rule on years of data, you can see if it would have been profitable and under what market conditions it works best.
Python offers several advantages for backtesting:
backtesting.py, vectorbt, and zipline.This guide is structured to take you from a complete beginner to a confident backtesting practitioner. You will learn:
backtesting.py with a moving average crossover strategy.To give you a taste, here is a minimal backtest using the backtesting.py library. This example defines a simple strategy that buys when the 10-period moving average crosses above the 30-period moving average:
from backtesting import Backtest, Strategy
from backtesting.lib import crossover
import pandas as pd

class SmaCross(Strategy):
    n1 = 10
    n2 = 30

    def init(self):
        self.sma1 = self.I(lambda x: pd.Series(x).rolling(self.n1).mean(), self.data.Close)
        self.sma2 = self.I(lambda x: pd.Series(x).rolling(self.n2).mean(), self.data.Close)

    def next(self):
        if crossover(self.sma1, self.sma2):
            self.buy()
        elif crossover(self.sma2, self.sma1):
            self.sell()

data = pd.read_csv('AAPL.csv', index_col=0, parse_dates=True)
bt = Backtest(data, SmaCross, cash=10000, commission=.002)
results = bt.run()
print(results)
bt.plot()
This code loads historical data, runs the strategy, prints performance statistics, and plots the equity curve. For a step-by-step walkthrough, check out our Simple Python Backtesting Tutorial for Beginners (2026).
The table below compares Python backtesting with traditional alternatives:
| Feature | Python (backtesting.py) | Excel | MetaTrader (MQL) |
|---|---|---|---|
| Ease of Use | Moderate (requires coding) | Easy for simple strategies | Moderate (MQL language) |
| Flexibility | Very high | Low | Medium |
| Data Handling | Excellent (pandas) | Limited | Good |
| Performance Metrics | Built-in (Sharpe, drawdown, etc.) | Manual calculation | Basic |
| Visualization | Interactive plots | Basic charts | Good |
| Cost | Free | License required | Free with broker |
If you want to compare Python backtesting with other trading environments, see our comparison of MetaTrader and modern backtesting platforms.
Choosing the right timeframe for your backtest is crucial. A strategy that works on daily data may fail on intraday data. Learn more about how timeframe affects backtest results.
As you progress through this guide, you will also discover how to optimize your strategy for maximum consistency and avoid overfitting. For a deeper dive into optimization techniques, refer to our article on How to optimize your trading strategy for maximum consistency. And if you are new to strategy development, start with How to Create a Profitable Trading Strategy: Step-by-Step Guide.
By the end of this guide, you will have a solid foundation in Python backtesting and be ready to apply these skills to your own trading ideas. Let's get started!
A successful Python backtesting project follows a structured workflow rather than jumping directly into coding. Each stage builds on the previous one and helps reduce errors before deploying a strategy in live markets.
Define a trading hypothesis based on market behavior.
Convert the idea into objective entry and exit rules.
Collect clean and reliable historical price data.
Implement the strategy using a Python backtesting library.
Run simulations and evaluate trading performance.
Fine-tune parameters while avoiding overfitting.
Use out-of-sample and walk-forward testing.
Deploy the validated strategy in real markets.
Different trading systems require different backtesting approaches. Understanding these methods helps you choose the right framework for your strategy and computational needs.
Event-driven engines process market events one at a time, closely simulating real-world trading conditions. They support order execution, commissions, slippage, and portfolio management, making them ideal for production-grade strategies.
Vectorized backtesting performs calculations on entire datasets simultaneously using libraries such as NumPy and Pandas. This approach is significantly faster and is widely used for quantitative research and parameter optimization.
Hybrid frameworks combine the speed of vectorized calculations with the realism of event-driven simulations. They provide an excellent balance between research efficiency and accurate execution modeling.
Python backtesting works by recreating historical market scenarios and applying a trading strategy to past data to measure how it would have performed. Instead of testing ideas with real money, traders can use Python to simulate trades, analyze results, and identify potential weaknesses before deploying a strategy in live markets.
At its core, a backtesting system compares historical market conditions with predefined trading rules. When the strategy generates an entry or exit signal, the backtesting engine records simulated trades and calculates the overall performance of the strategy.
Python is widely used for backtesting because it provides a complete ecosystem for quantitative analysis. Libraries such as Pandas and NumPy help process market data, while visualization tools like Matplotlib and Plotly make performance analysis easier. Dedicated frameworks such as backtesting.py, VectorBT, and Backtrader simplify strategy testing and research.
A successful backtesting process does not only focus on finding profitable results. It also helps traders understand risk, detect overfitting, and determine whether a strategy can remain effective across different market conditions.
Before you can backtest a single trade, you need a solid Python environment and the right library for your skill level and goals. This section walks you through installing Python, essential data science libraries, and the most popular backtesting frameworks. By the end, you'll know exactly which tools to install and which library best fits your trading style.
Python 3.9 or later is recommended for backtesting in 2026. Download it from python.org and ensure you check "Add Python to PATH" during installation. Once Python is ready, open a terminal and install the core libraries:
pip install pandas numpy matplotlib seaborn scipy
pip install backtesting.py yfinance vectorbt
These packages cover data manipulation (pandas), numerical computing (numpy), visualization (matplotlib, seaborn), statistical analysis (scipy), and backtesting (backtesting.py, vectorbt). For data fetching, yfinance gives free access to Yahoo Finance historical data.
A complete Python backtesting workflow typically involves several complementary tools. Pandas and NumPy provide the foundation for data manipulation and numerical analysis, while Matplotlib and Plotly are commonly used to visualize equity curves, indicators, and performance metrics. For cryptocurrency strategies, many traders rely on CCXT to access exchange data and trading APIs. When moving from research to execution, brokers such as Interactive Brokers and exchanges that support the Binance API are frequently integrated into automated trading workflows.
Run this script to confirm everything is installed correctly:
import pandas as pd
import numpy as np
import matplotlib.pyplot as plt
import backtesting as bt
import yfinance as yf

print('Pandas version:', pd.__version__)
print('NumPy version:', np.__version__)
print('backtesting.py version:', bt.__version__)
print('All libraries installed successfully!')
If you see version numbers without errors, you're ready to start backtesting. For a deeper walkthrough of the first backtest, see our Simple Python Backtesting Tutorial for Beginners (2026).
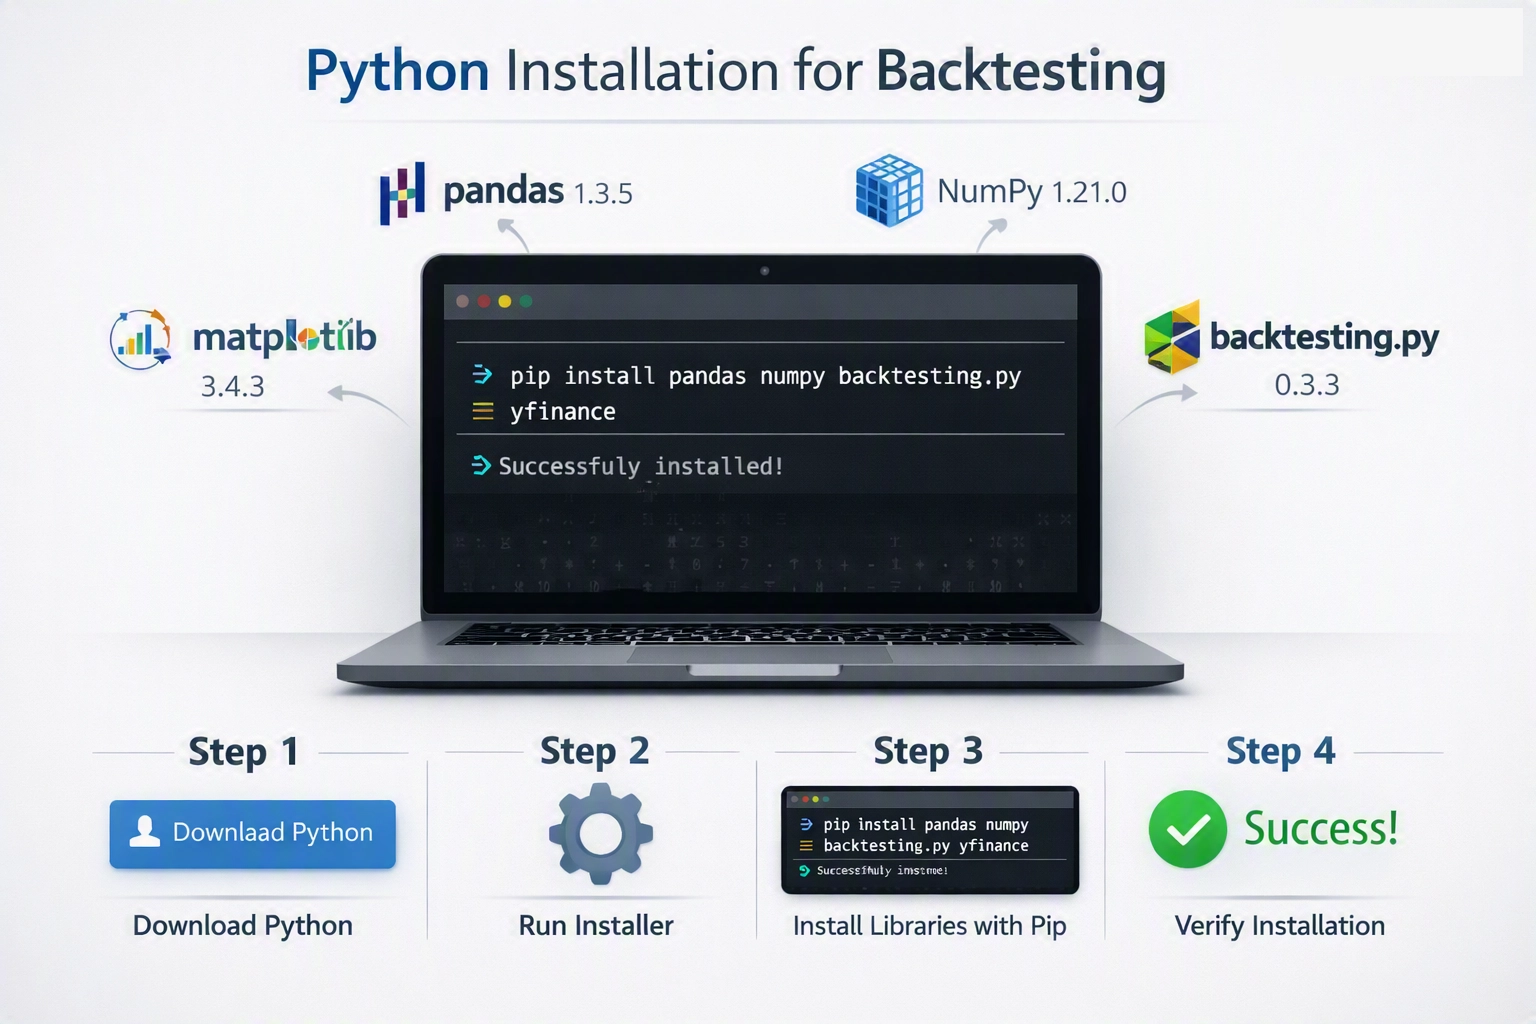
Download Python → Install Libraries → Verify Setup
Not all backtesting libraries are created equal. Some prioritize speed, others ease of use, and a few focus on advanced statistical methods. For a detailed comparison of the most popular frameworks, see our guide on Python backtesting libraries . Below is a comparison of the four most popular libraries in 2026.
| Library | Best For | Pros | Cons |
|---|---|---|---|
| backtesting.py | Beginners, rapid prototyping | Simple API, built-in metrics, interactive plots, good documentation | Limited to single-asset strategies, slower for large datasets |
| vectorbt | Advanced users, portfolio backtesting, high-frequency data | Extremely fast (NumPy-based), supports vectorized operations, multi-asset, extensive indicators | Steeper learning curve, less intuitive for beginners |
| zipline | Production-grade backtesting, event-driven systems | Realistic simulation, supports slippage/commissions, used by Quantopian (legacy) | Complex setup, heavy dependencies, slower for quick tests |
| bt | Modular strategy development, research | Flexible, allows chaining strategies, good for experimentation | Less active development, smaller community |
Use this quick reference to select the right solution:
| Your Goal | Recommended Solution | Why? |
|---|---|---|
| Learning Python Backtesting | backtesting.py | Simple API and beginner-friendly workflow. |
| High-Speed Research | VectorBT | Fast vectorized strategy testing. |
| Professional Event-Driven Systems | Zipline | Advanced execution modeling. |
| Portfolio Backtesting | bt | Designed for multi-asset strategies. |
| No-Code Strategy Development | Algotradium | Build and test strategies without coding. |
If you're new to algorithmic trading, backtesting.py is the best starting point. Its API is intuitive: you define a strategy as a class with init() and next() methods, then run it with a single line. It automatically calculates key metrics like Sharpe ratio, maximum drawdown, and win rate, and generates an interactive equity curve. For example, a simple moving average crossover strategy can be written in under 20 lines of code.
from backtesting import Backtest, Strategy
from backtesting.lib import crossover
import pandas as pd

class SmaCross(Strategy):
    n1 = 10
    n2 = 20
    def init(self):
        self.sma1 = self.I(lambda x: pd.Series(x).rolling(self.n1).mean(), self.data.Close)
        self.sma2 = self.I(lambda x: pd.Series(x).rolling(self.n2).mean(), self.data.Close)
    def next(self):
        if crossover(self.sma1, self.sma2):
            self.buy()
        elif crossover(self.sma2, self.sma1):
            self.sell()

data = pd.read_csv('AAPL.csv', index_col=0, parse_dates=True)
bt = Backtest(data, SmaCross, cash=10000, commission=.002)
results = bt.run()
print(results)
bt.plot()
This code loads historical data, defines a 10/20 SMA crossover, runs the backtest, and prints performance metrics. The built-in plot shows trades and equity curve.
For more advanced users, vectorbt offers lightning-fast vectorized backtesting that can test thousands of parameter combinations in seconds. It's ideal for walk-forward analysis and Monte Carlo simulations, which we cover in later sections. If you plan to trade multiple assets or need high-frequency data, vectorbt is worth the learning curve.
Zipline remains a solid choice for those who want a realistic, event-driven simulation with slippage and commission models. However, its setup is more involved, and it's overkill for simple strategies. bt is a flexible library that lets you compose strategies from reusable components, but its community has shrunk.
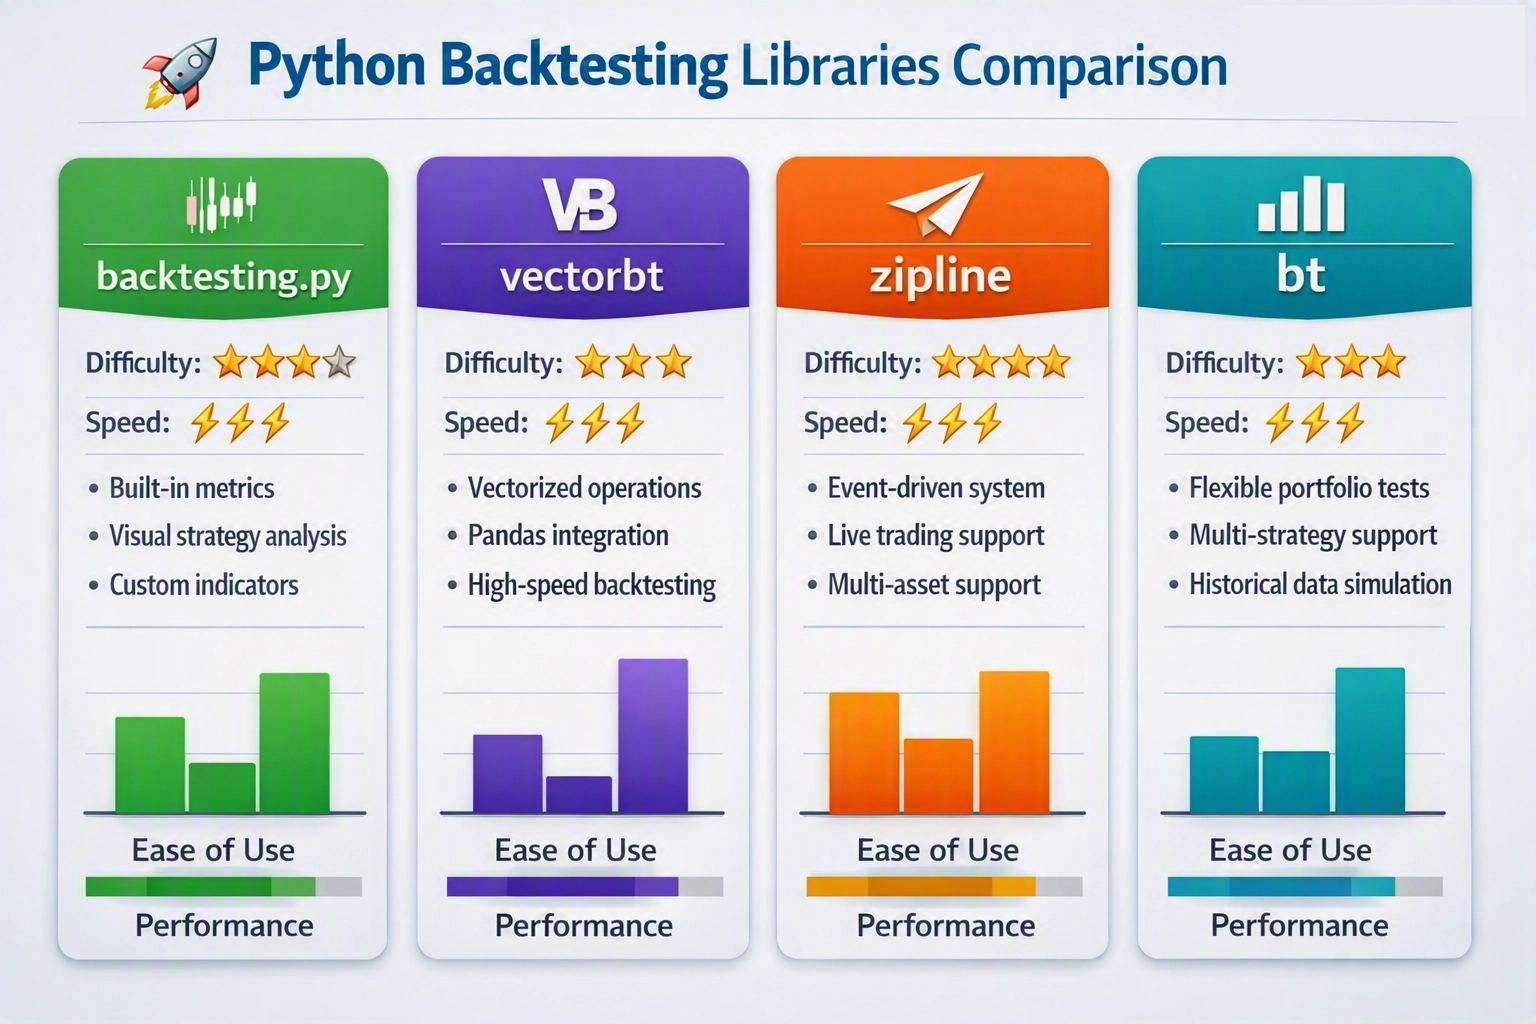
backtesting.py · vectorbt · zipline · bt
When choosing a library, also consider the timeframe of your data. For example, backtesting.py works well with daily data, while vectorbt excels with minute or tick data. Our guide on Best Trading Timeframes for Backtesting explains how timeframe affects your results.
Finally, remember that the best library is the one you'll actually use. Start with backtesting.py to learn the fundamentals, then graduate to vectorbt or zipline as your strategies grow more complex. For a broader perspective on building profitable strategies, read build a profitable trading strategy.
Once your environment is set and you've chosen a library, the next step is collecting and preparing historical data. That's covered in the following section.
Although Python backtesting is one of the most valuable tools in algorithmic trading, it cannot guarantee future profitability. Historical performance should be treated as evidence—not proof—that a strategy may work under similar market conditions.
To improve reliability, combine backtesting with out-of-sample testing, walk-forward analysis, paper trading, and disciplined risk management before deploying a strategy with real capital.
Before you can backtest any trading strategy, you need reliable historical data. The quality, frequency, and source of your data directly affect the validity of your backtest results. In this section, you'll learn where to get free and paid historical data, how to clean and prepare it for analysis, and then build a complete moving average crossover backtest using the backtesting.py library. By the end, you'll have a working backtest that produces an equity curve and a trade list.
Choosing the right data source depends on your budget, required asset classes, and data frequency. Below is a comparison of popular free and paid sources.
| Source | Cost | Data Quality | Ease of Use | Limitations |
|---|---|---|---|---|
Yahoo Finance (via yfinance) | Free | Good for daily data; intraday may have gaps | Very easy – one-line download | Rate limits, no guarantee of accuracy, survivorship bias |
| Alpha Vantage | Free tier (5 calls/min, 500/day) | Good for US stocks, forex, crypto | Easy – API key required | Limited free calls; premium plans expensive |
| Quandl (Nasdaq Data Link) | Free tier (limited datasets) | Excellent for end-of-day and fundamental data | Moderate – requires API key | Free tier very limited; paid plans costly |
| Intrinio | Paid (starts at ~$50/month) | High-quality, real-time and historical | Easy – REST API | Cost barrier for hobbyists |
| Polygon.io | Paid (starts at $29/month) | Excellent for intraday and options | Easy – WebSocket & REST | No free tier for historical data |
For this tutorial, we'll use Yahoo Finance because it's free, widely used, and simple to access via the yfinance library. Install it with:
pip install yfinance pandas matplotlib backtesting.pyNow download historical daily data for Apple (AAPL) from 2020 to 2025:
import yfinance as yf
import pandas as pd

ticker = "AAPL"
data = yf.download(ticker, start="2020-01-01", end="2025-12-31", progress=False)
data.head()
The DataFrame contains Open, High, Low, Close, Volume, and Adjusted Close. The adjusted close accounts for stock splits and dividends, which is essential for accurate backtesting.
Raw data often has missing values (e.g., holidays, weekends) and may need resampling to a different timeframe. For daily strategies, we can simply drop NaN rows or forward-fill. For intraday strategies, you'll need to resample to your desired frequency.
Here's a typical cleaning pipeline:
# Drop rows with any missing values
data.dropna(inplace=True)

# Ensure the index is datetime
data.index = pd.to_datetime(data.index)

# Resample to weekly data (if needed) – take the last close of each week
weekly = data.resample('W').agg({
    'Open': 'first',
    'High': 'max',
    'Low': 'min',
    'Close': 'last',
    'Volume': 'sum',
    'Adj Close': 'last'
})
weekly.dropna(inplace=True)
For most backtesting libraries, you only need the 'Open', 'High', 'Low', 'Close', and 'Volume' columns. The backtesting.py library expects a DataFrame with these columns and a datetime index. If you're using adjusted close, replace the 'Close' column with adjusted close to avoid survivorship bias.
For a deeper discussion on choosing the right timeframe for your strategy, see our guide on choosing the right timeframe for your strategy.
Now we'll implement a simple moving average crossover strategy. The strategy buys when a short-term moving average crosses above a long-term moving average, and sells when it crosses below.
First, define the strategy class:
from backtesting import Backtest, Strategy
from backtesting.lib import crossover

class SmaCross(Strategy):
    n1 = 10  # short moving average period
    n2 = 30  # long moving average period

    def init(self):
        # Calculate moving averages
        self.sma1 = self.I(lambda x: pd.Series(x).rolling(self.n1).mean(), self.data.Close)
        self.sma2 = self.I(lambda x: pd.Series(x).rolling(self.n2).mean(), self.data.Close)

    def next(self):
        # If short MA crosses above long MA, buy
        if crossover(self.sma1, self.sma2):
            self.buy()
        # If short MA crosses below long MA, sell
        elif crossover(self.sma2, self.sma1):
            self.sell()
Explanation:
init() is called once at the start. We use self.I() to add custom indicators (moving averages). The library automatically handles look-ahead bias by only using past data.next() is called on every bar. crossover() returns True only when the first series crosses above the second on the current bar.self.buy() and self.sell() place market orders. By default, self.sell() closes any long position and opens a short.Now run the backtest:
bt = Backtest(data, SmaCross, cash=10000, commission=.002)
results = bt.run()
print(results)
The output includes key metrics like Sharpe ratio, max drawdown, and total return. For a complete breakdown of these metrics, see the Python backtesting tutorial for beginners.
To see the equity curve and trade list, use:
bt.plot()You can also inspect individual trades:
trades = results._trades
trades.head()
The trade list allows you to analyze each trade's profit/loss and timing. This is invaluable for understanding strategy behavior.
You now have a working backtest pipeline. However, a single backtest is not enough to validate a strategy. You need to optimize parameters and test on out-of-sample data to avoid overfitting. The next section covers performance metrics in depth, and later we'll explore walk-forward analysis and Monte Carlo simulation. For a broader perspective on strategy development, check out How to Create a Profitable Trading Strategy: Step-by-Step Guide.
Remember: backtesting is a tool, not a crystal ball. Always combine it with forward testing and proper risk management.
Once you have a working backtest, the next step is to measure how well your strategy performs and then improve it. This section covers the essential metrics every trader should know—Sharpe ratio, maximum drawdown, win rate, and more—and shows you how to calculate them in Python. Then we dive into optimization techniques like grid search, random search, and walk-forward analysis to avoid overfitting and build robust strategies.
Performance metrics transform raw trade data into actionable insights. They help you compare strategies, assess risk, and decide whether a strategy is worth trading live. Below are the most important metrics, with Python code to compute them from a backtest's equity curve.
The Sharpe ratio measures risk-adjusted returns. It is calculated as:
Sharpe Ratio = (Mean Return - Risk-Free Rate) / Std Dev of ReturnsA Sharpe ratio above 1 is considered good, above 2 is excellent, above 3 is outstanding. In Python, you can compute it from daily returns:
import numpy as np

def sharpe_ratio(returns, risk_free_rate=0.0):
    excess_returns = returns - risk_free_rate / 252  # daily risk-free rate
    return np.sqrt(252) * excess_returns.mean() / excess_returns.std()

# Example usage with backtest equity curve
daily_returns = equity_curve.pct_change().dropna()
sr = sharpe_ratio(daily_returns)
print(f'Sharpe Ratio: {sr:.2f}')
Maximum drawdown (Max DD) is the largest peak-to-trough decline in the equity curve. It shows the worst-case loss you would have experienced. Calculate it as:
def max_drawdown(equity_curve):
    cumulative = (1 + equity_curve.pct_change()).cumprod()
    running_max = cumulative.cummax()
    drawdown = (cumulative - running_max) / running_max
    return drawdown.min()

max_dd = max_drawdown(equity_curve)
print(f'Maximum Drawdown: {max_dd:.2%}')Other useful metrics include:
Here's a complete function to compute all common metrics from a list of trades:
def compute_metrics(trades, equity_curve):
    winning_trades = trades[trades['Profit'] > 0]
    win_rate = len(winning_trades) / len(trades)
    profit_factor = winning_trades['Profit'].sum() / abs(trades[trades['Profit'] < 0]['Profit'].sum())
    total_return = (equity_curve.iloc[-1] / equity_curve.iloc[0]) - 1
    annual_return = (1 + total_return) ** (252 / len(equity_curve)) - 1
    max_dd = max_drawdown(equity_curve)
    calmar = annual_return / abs(max_dd)
    sharpe = sharpe_ratio(equity_curve.pct_change().dropna())
    return {
        'Win Rate': win_rate,
        'Profit Factor': profit_factor,
        'Sharpe Ratio': sharpe,
        'Max Drawdown': max_dd,
        'Calmar Ratio': calmar
}Optimization adjusts a strategy's parameters to improve performance. However, naive optimization can lead to overfitting—a strategy that works perfectly on historical data but fails in live trading. The key is to use robust methods.
Grid search tests every combination of parameter values. For a simple moving average crossover, you might test fast periods from 5 to 50 and slow periods from 20 to 200. Here's an example using backtesting.py:
from backtesting import Backtest, Strategy
from backtesting.lib import crossover
import pandas as pd

class SmaCross(Strategy):
    n1 = 10
    n2 = 30
    def init(self):
        self.sma1 = self.I(lambda x: pd.Series(x).rolling(self.n1).mean(), self.data.Close)
        self.sma2 = self.I(lambda x: pd.Series(x).rolling(self.n2).mean(), self.data.Close)
    def next(self):
        if crossover(self.sma1, self.sma2):
            self.buy()
        elif crossover(self.sma2, self.sma1):
            self.sell()

# Grid search
fast_range = range(5, 50, 5)
slow_range = range(20, 200, 10)
results = []
for n1 in fast_range:
    for n2 in slow_range:
        if n1 >= n2:
            continue
        bt = Backtest(data, SmaCross, cash=10000, commission=.002)
        stats = bt.run(n1=n1, n2=n2)
        results.append({'n1': n1, 'n2': n2, 'Sharpe': stats['Sharpe Ratio']})

best = max(results, key=lambda x: x['Sharpe'])
print(f'Best parameters: n1={best["n1"]}, n2={best["n2"]}, Sharpe={best["Sharpe"]:.2f}')
Random search samples parameter combinations randomly, which is more efficient when the parameter space is large. Use random.sample or numpy.random to generate combinations.
Walk-forward analysis simulates how a strategy would have performed if you re-optimized periodically. It splits data into training and testing windows, optimizes on the training set, and tests on the next period. This reduces overfitting. Here's a simplified implementation:
def walk_forward(data, strategy, param_grid, train_size=0.6, step=0.1):
    total_len = len(data)
    train_len = int(total_len * train_size)
    step_len = int(total_len * step)
    results = []
    for start in range(0, total_len - train_len, step_len):
        train_data = data.iloc[start:start+train_len]
        test_data = data.iloc[start+train_len:start+train_len+step_len]
        # Optimize on train_data
        bt_train = Backtest(train_data, strategy, cash=10000, commission=.002)
        stats_train = bt_train.optimize(
            n1=param_grid['n1'], n2=param_grid['n2'],
            maximize='Sharpe Ratio',
            constraint=lambda p: p.n1 < p.n2
        )
        # Test on test_data
        bt_test = Backtest(test_data, strategy, cash=10000, commission=.002)
        stats_test = bt_test.run(**stats_train._params)
        results.append(stats_test)
return results| Method | Pros | Cons | Best Use Case |
|---|---|---|---|
| Grid Search | Exhaustive, easy to implement | Computationally expensive, prone to overfitting | Small parameter spaces |
| Random Search | More efficient, can explore large spaces | May miss optimal combination | Large parameter spaces |
| Walk-Forward | Reduces overfitting, simulates real-world | More complex, requires careful window sizing | Any strategy intended for live trading |
For a deeper dive into avoiding overfitting and building consistent strategies, read our guide on Python strategy optimization techniques. Also, the choice of timeframe can significantly impact your metrics—learn more in Best Trading Timeframes for Backtesting & Strategies.
Manually running grid searches and walk-forward analysis can be time-consuming. The Algotradium platform offers automated backtesting and optimization with built-in walk-forward analysis, Monte Carlo simulation, and risk metrics—all without coding. Try Algotradium for free and focus on strategy development, not infrastructure.
By mastering these metrics and optimization techniques, you'll be able to separate robust strategies from overfitted ones and increase your chances of success in live markets.
Monte Carlo simulation, out-of-sample testing, and avoiding biases
Once you have a basic backtest running, the real challenge begins: ensuring your strategy is robust enough to survive live markets. Advanced techniques like Monte Carlo simulation and out-of-sample testing help you separate signal from noise, while awareness of common biases prevents you from being fooled by false confidence. In this section, we'll dive into these concepts and show you how to implement them in Python.
Monte Carlo simulation randomly perturbs the sequence of trade returns to generate hundreds or thousands of alternative equity curves. This reveals the range of possible outcomes and helps you estimate the probability of drawdowns or failure. For example, you can shuffle the order of trades (with replacement) to see how sensitive your strategy is to the timing of wins and losses.
import numpy as np
import pandas as pd

# Assume 'trades' is a DataFrame with a 'return' column
def monte_carlo_equity(trades, n_simulations=1000, initial_capital=10000):
    returns = trades['return'].values
    simulations = []
    for _ in range(n_simulations):
        shuffled = np.random.choice(returns, size=len(returns), replace=True)
        equity = initial_capital * (1 + shuffled).cumprod()
        simulations.append(equity)
    return pd.DataFrame(simulations).T

sim_df = monte_carlo_equity(trades)
# Plot percentiles
import matplotlib.pyplot as plt
plt.figure(figsize=(10,6))
plt.plot(sim_df.quantile(0.5, axis=1), label='Median')
plt.fill_between(sim_df.index, sim_df.quantile(0.05, axis=1), sim_df.quantile(0.95, axis=1), alpha=0.3, label='90% CI')
plt.title('Monte Carlo Simulation - Equity Curves')
plt.legend()
plt.show()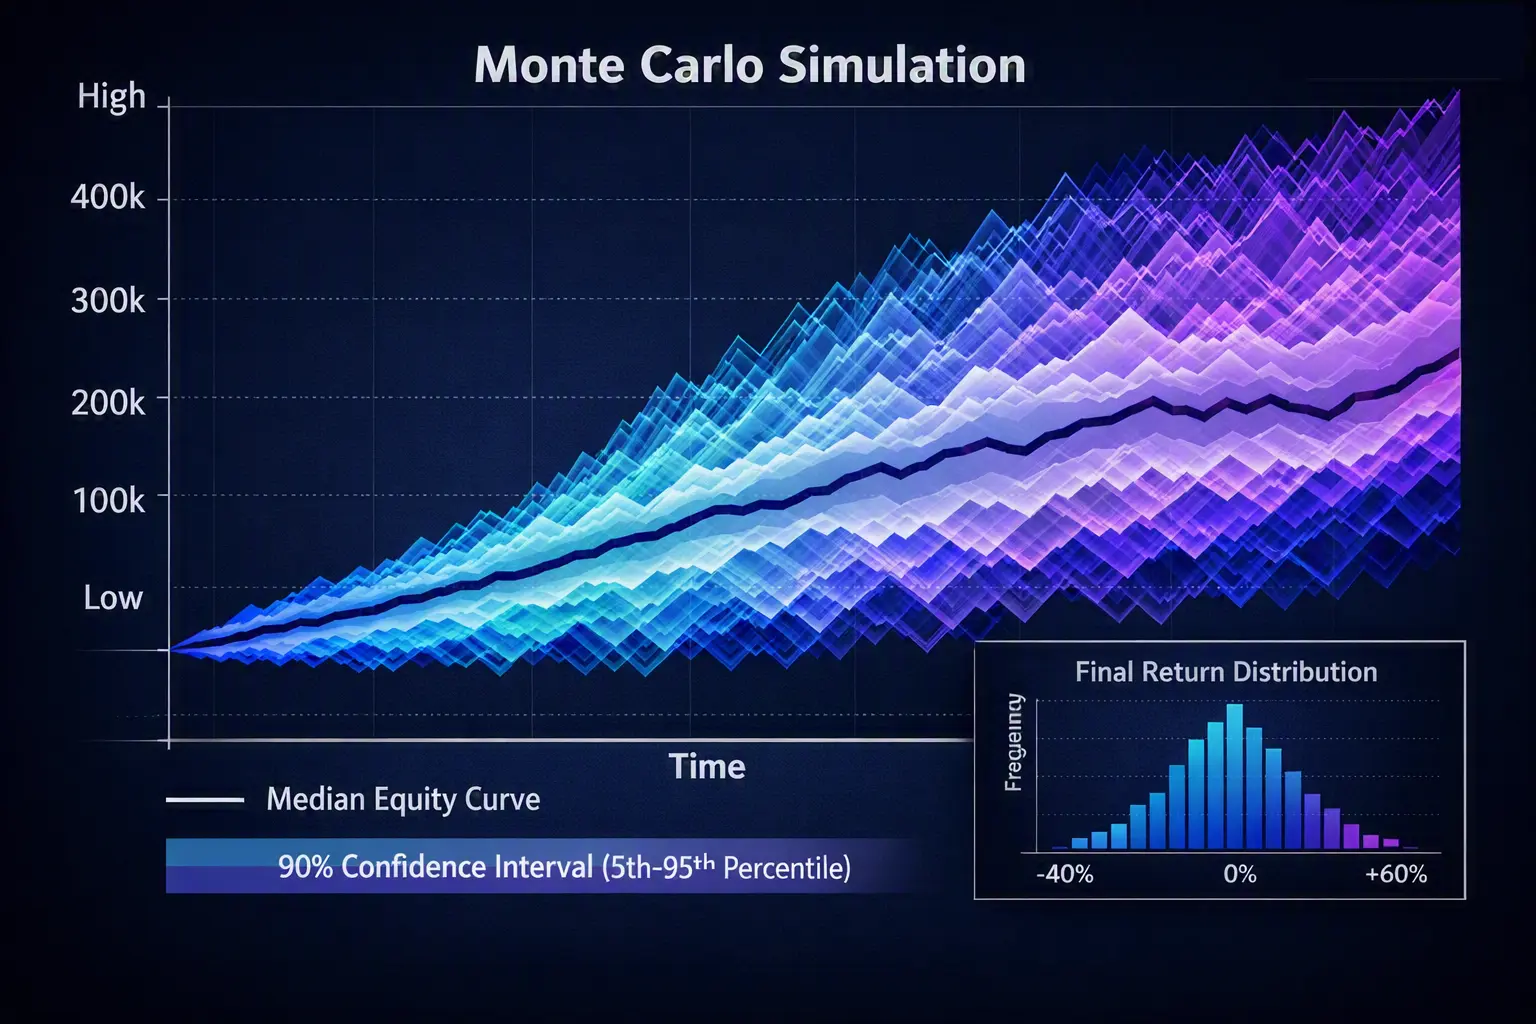
Multiple equity curves with confidence intervals
If the 5th percentile equity curve ends below your maximum acceptable drawdown, the strategy may be too risky. Monte Carlo is also useful for estimating the probability of achieving a target return.
Backtesting on the same data you used for optimization leads to overfitting. The gold standard is to reserve a portion of historical data as an out-of-sample (OOS) period that is never touched during parameter tuning. Walk-forward analysis takes this further by repeatedly optimizing on a rolling window and testing on the next segment.
# Simplified walk-forward example
from backtesting import Backtest, Strategy

def walk_forward(strategy_class, data, train_window=252, test_window=63):
    results = []
    for i in range(train_window, len(data), test_window):
        train = data.iloc[i-train_window:i]
        test = data.iloc[i:i+test_window]
        bt = Backtest(train, strategy_class, cash=10000)
        stats = bt.optimize(...)  # optimize on train
        bt_test = Backtest(test, strategy_class, cash=10000)
        test_stats = bt_test.run()
        results.append(test_stats)
return results| Testing Type | Description | Risk of Overfitting |
|---|---|---|
| In-Sample Only | Train and test on same data | Very High |
| Simple OOS | Hold out a fixed period | Medium |
| Walk-Forward | Rolling optimization and testing | Low |
| Time Series Cross-Validation | Multiple train/test splits respecting time order | Low |
For a deeper dive into walk-forward analysis, see our guide on how to optimize your trading strategy for maximum consistency.
Occurs when your backtest uses information that wouldn't have been available at the time of the trade. For example, using the day's closing price to enter a trade at the open. Solution: Always align data to the correct timestamp. Use .shift() to avoid peeking into the future.
Using only stocks that still exist today ignores delisted companies, inflating returns. Solution: Use point-in-time data from providers like CRSP or Quandl. For free data, be aware that Yahoo Finance may have survivorship bias.
Optimizing too many parameters until the strategy perfectly fits historical noise. Detection: Large gap between in-sample and out-of-sample performance. Prevention: Keep strategies simple, use walk-forward analysis, and apply Monte Carlo simulation.
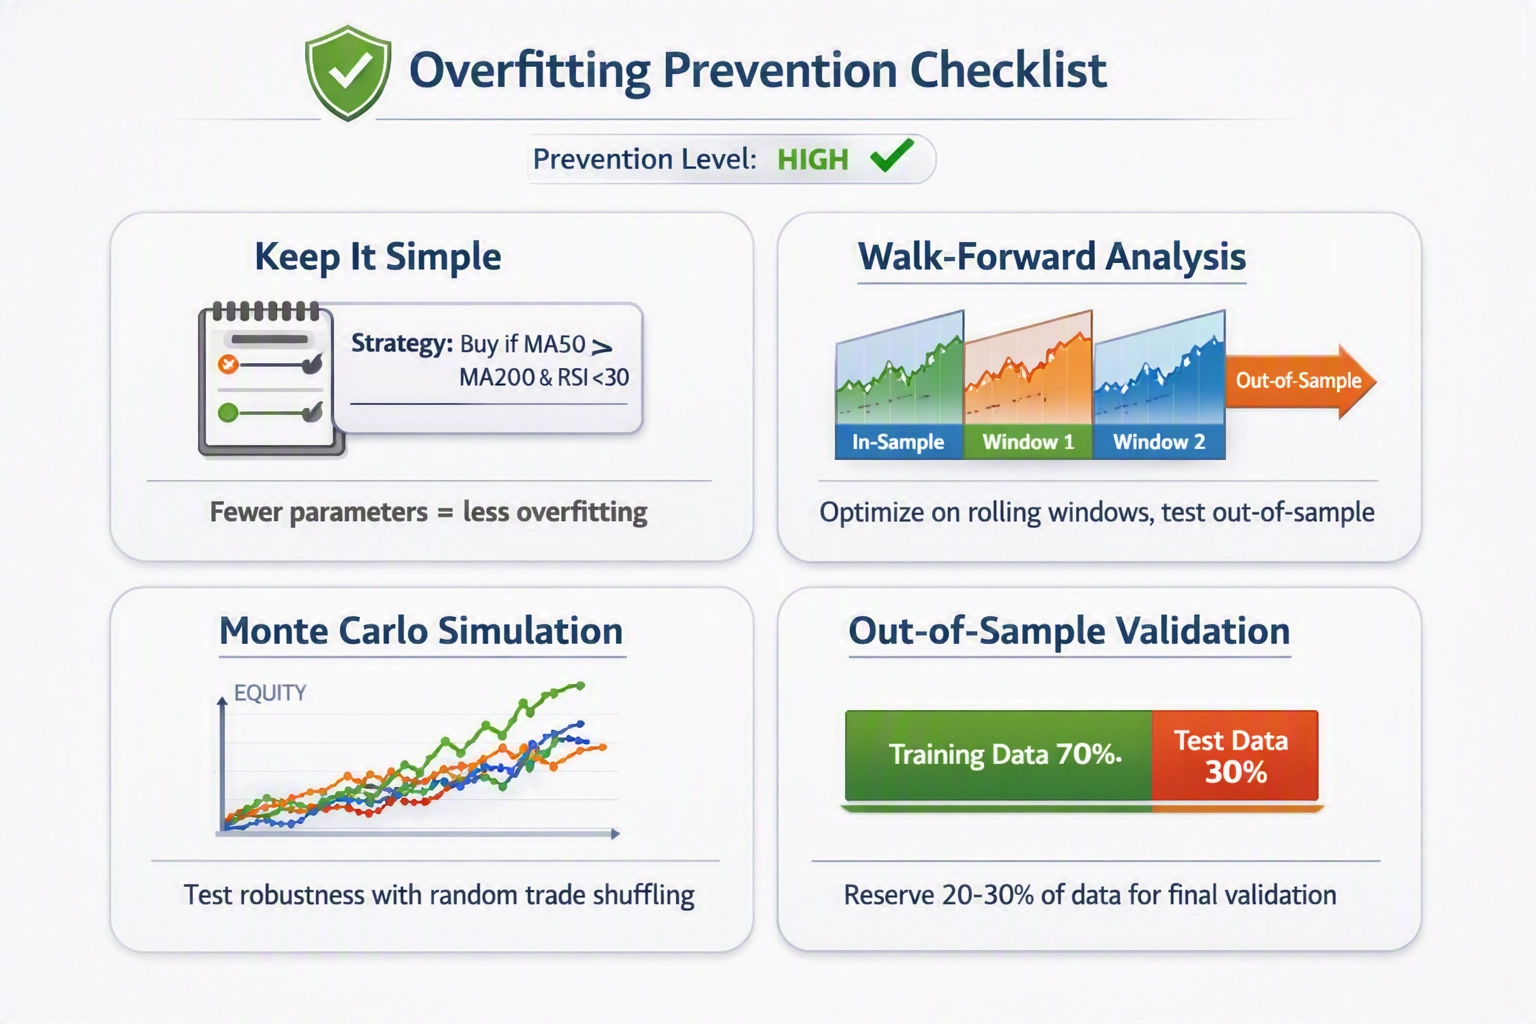
Simplicity · Walk-Forward · Monte Carlo · Out-of-Sample Testing
Another subtle pitfall is timeframe mismatch. Backtesting on daily data but executing on intraday can lead to unrealistic fills. Our article on best trading timeframes for backtesting & strategies explains how to align your data with your trading horizon.
Finally, remember that backtesting is just the first step. Combine it with forward testing and paper trading before risking real capital. For a complete framework, read How to Create a Profitable Trading Strategy: Step-by-Step Guide.
By incorporating Monte Carlo simulation, out-of-sample validation, and a healthy skepticism of biases, you'll build strategies that are far more likely to succeed in live markets. Start with the basics in our Simple Python Backtesting Tutorial for Beginners (2026) and then apply these advanced techniques to take your backtesting to the next level.
While Python provides powerful tools for building and testing trading strategies, running a complete backtesting workflow still requires multiple steps, including data preparation, strategy configuration, performance evaluation, and result analysis.
Algotradium provides an automated backtesting environment designed to simplify this process. Instead of managing every technical component manually, users can evaluate their trading ideas through a structured workflow and focus more on strategy development and analysis.
A backtesting platform can help traders reduce repetitive tasks and organize the strategy evaluation process more efficiently. Key benefits include:
For developers and quantitative traders who prefer full control, Python libraries such as backtesting.py, Backtrader, and VectorBT remain valuable options. However, an automated platform can be useful when you want to validate ideas faster without spending additional time on infrastructure and repetitive setup.
Algotradium provides a structured environment where traders can organize strategy ideas, run backtests, and analyze results without managing every technical component of the workflow themselves.
If you want to evaluate trading ideas without building the entire backtesting infrastructure yourself, Algotradium provides a structured environment for testing and analyzing strategies.
Explore Algotradium PlatformBefore trusting any backtesting results, make sure your strategy follows these essential best practices. This checklist helps you avoid common mistakes and build more reliable Python backtesting workflows.
Python backtesting is an essential step in algorithmic trading strategy development. It allows traders to test ideas on historical data, evaluate performance, and identify potential weaknesses before risking real capital.
A reliable backtesting workflow requires choosing the right tools, using quality data, avoiding overfitting, and validating strategies with realistic performance metrics.
The best tool depends on your goals and experience level:
For a practical introduction, see our Simple Python Backtesting Tutorial for Beginners (2026) .
A strategy that performs well on historical data may fail in live markets if it is over-optimized. Use techniques such as walk-forward analysis, out-of-sample testing, and Monte Carlo simulation to evaluate whether your strategy can handle different market conditions.
Do not judge a strategy only by total return. Important metrics include:
Python offers complete flexibility, but managing data, infrastructure, and execution can require significant technical effort. Platforms like Algotradium can help traders streamline backtesting and strategy development workflows.
Backtesting is not a guarantee of future profits. It is a tool for improving strategy quality, discovering weaknesses, and building confidence before live deployment. Always combine historical testing with forward testing and continuous optimization.
For a complete strategy development process, read our guide: How to Create a Profitable Trading Strategy: Step-by-Step Guide .
Algotradium provides educational resources about algorithmic trading, quantitative analysis, and trading strategy development.
Through practical tutorials and technical guides, the platform helps readers better understand concepts such as Python backtesting, strategy evaluation, and systematic trading workflows.
Python backtesting is the process of testing a trading strategy on historical market data before using it in live trading. It allows traders to evaluate performance, identify weaknesses, and optimize strategies without risking real capital. A reliable Python backtesting workflow helps improve confidence before deployment.
Yes. Python is considered one of the best programming languages for backtesting because it offers powerful data analysis libraries, flexible strategy development, extensive visualization tools, and a large ecosystem of open-source backtesting frameworks such as backtesting.py, VectorBT, and Backtrader.
The best library depends on your goals. backtesting.py is excellent for beginners because it is simple and well documented. VectorBT is ideal for high-speed quantitative research, while Backtrader offers advanced customization for complex trading systems.
It depends on your experience and project requirements. backtesting.py is easier to learn and perfect for beginners, while Backtrader provides greater flexibility for advanced trading systems, multi-asset portfolios, and complex execution logic.
No. Backtesting is only the first step. A complete strategy should also be validated using out-of-sample testing, walk-forward analysis, paper trading, and risk management before it is deployed with real money.
The amount of historical data depends on your trading style. Swing strategies often require several years of daily data, while intraday systems usually need months or years of minute-level data to produce statistically meaningful results.
You can reduce overfitting by keeping strategies simple, limiting parameter optimization, testing on unseen data, and validating results across different market conditions. Consistent performance is more important than exceptional historical returns.
Popular data sources include Yahoo Finance, Alpha Vantage, Polygon.io, Interactive Brokers, and Binance for cryptocurrency markets. Always verify data quality because inaccurate data can produce misleading backtesting results.
Yes. Most modern Python backtesting libraries support cryptocurrency data. By combining exchange APIs such as CCXT with historical price data, traders can evaluate crypto strategies using the same workflow as stocks or forex.
A good Python backtesting guide should explain strategy development, historical data collection, backtesting libraries, performance metrics, optimization, and common mistakes. Learning these fundamentals provides a solid foundation for algorithmic trading.
Besides dedicated backtesting libraries, traders frequently use Pandas and NumPy for data analysis, Matplotlib and Plotly for visualization, and CCXT for accessing cryptocurrency exchange data. These tools form a complete Python backtesting workflow.
Yes. After validating a strategy, many traders connect it to brokers or exchanges using APIs such as Interactive Brokers API or the Binance API. Live deployment should always follow thorough backtesting, paper trading, and proper risk management.